New rules, similar tempo
It's been almost two years since the four-outfielders rule was introduced, but while it has helped in boundary-hitting, the overall run rates haven't changed much
Over the last couple of years, more than one bowler and captain have raised concern over a specific change in rules in one-day internationals that limits the number of fielders outside the 30-yard to four, instead of five. This 20% reduction in cover in the outfield has had bowlers and fielding captains worried that the contest with be further skewed in favour of batsmen, and even mishits will be rewarded with runs as long as the ball clears the infield. It's been nearly two years since the rule came into effect, so it's a good time to check if the rule change has indeed had such an overwhelming effect on the game as some believe.
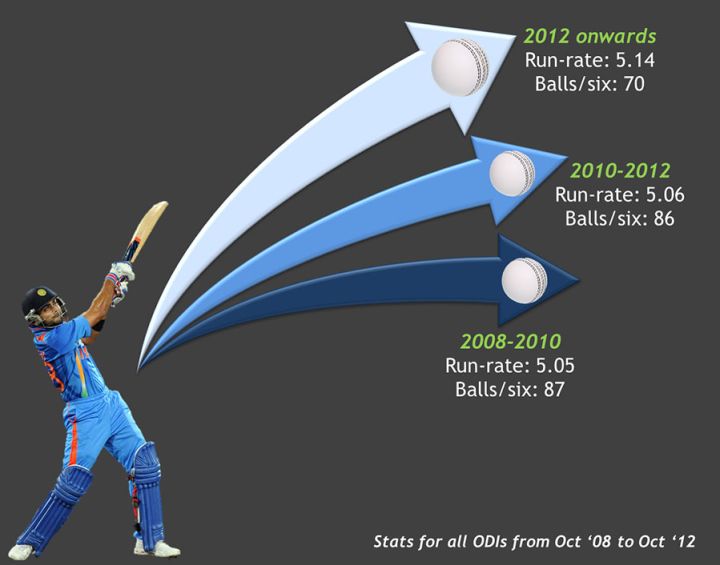
In the 227 ODIs that have been played since the rule change, the overall run rate hasn't gone up that much from the previous couple of years - from 5.06 it has crept up to 5.14, an increase of 1.6%. The averages are very similar as well. What has changed, though, is the frequency of batsmen clearing the boundary: in the previous four years, the average rate of batsmen hitting sixes was once every 86 balls; in the last two years, the frequency has increased to one every 70 balls. A 20% reduction in the number of fielders outside the circle in the non-Powerplay overs has resulted in a 19% increase in the frequency of sixes.
The difference between the last two years and the earlier ones is even more prominent - in terms of frequency of sixes - for teams batting first in ODIs. It's gone up from one every 89 balls to one every 65, an increase of 27%. The run rate has only gone up by about 2%, which means batsmen are playing more dot balls, but also making up for that by striking more sixes.
| Overall | Teams batting 1st | ||||||||
| Period | Matches | Average | Run rate | Balls per 4/6 | Dot % | Average | run rate | Balls per 4/6 | Dot % |
| Oct 30, 2012 onwards | 227 | 30.62 | 5.14 | 13.4/ 70.1 | 55.0 | 31.51 | 5.20 | 13.9/ 64.6 | 54.0 |
| Oct 30, 2010 to Oct 29, 2012 | 242 | 30.51 | 5.06 | 14.6/ 86.2 | 53.7 | 30.03 | 5.08 | 14.9/ 88.9 | 52.5 |
| Oct 30, 2008 to Oct 29, 2010 | 294 | 30.36 | 5.05 | 14.1/ 86.8 | 54.2 | 29.84 | 5.07 | 14.6/ 82.0 | 53.4 |
In some countries, though, the rule change has impacted boundary-hitting more than others, though the sample sizes are admittedly small in some countries, because of which a final verdict must wait. In India, for instance, there have been 18 matches played under the new set of rules, and in these games, there's been a six hit every 50 balls. In the previous couple of years, the average in India was a six every 77 balls, which means the increase has been almost 35%. The run rate increase, though, has only been 5%. In Sri Lanka the run rate has gone up by about 11% too, along with an increase in the frequency of boundaries, but in Australia and England the scoring rates have dropped marginally. Again, though, some of the sample sizes are too small to draw firm conclusions from.
| Oct 30, 2012 onwards | Oct 30, 2010 to Oct 29, 2012 | |||||||
| Host country | Matches | Average | Run rate | Balls per 4/6 | Matches | Average | Run rate | Balls per 4/6 |
| New Zealand | 17 | 34.35 | 5.63 | 12.1/ 49.3 | 12 | 31.06 | 5.32 | 13.9/ 55.4 |
| India | 18 | 37.55 | 5.57 | 11.1/ 50.4 | 44 | 32.08 | 5.31 | 12.2/ 76.9 |
| Sri Lanka | 21 | 31.23 | 5.48 | 11.3/ 105.3 | 30 | 30.30 | 4.94 | 14.7/ 129.6 |
| England | 31 | 28.91 | 5.21 | 13.6/ 88.2 | 21 | 34.36 | 5.25 | 13.2/ 104.9 |
| South Africa | 14 | 29.92 | 5.19 | 13.0/ 76.6 | 13 | 29.81 | 5.19 | 14.9/ 83.7 |
| Australia | 15 | 29.83 | 5.13 | 13.4/ 90.9 | 25 | 31.36 | 5.29 | 15.7/ 118.2 |
| Zimbabwe | 25 | 31.73 | 5.01 | 15.0/ 69.6 | 11 | 35.78 | 4.96 | 15.0/ 94.5 |
| Bangladesh | 25 | 28.85 | 5.00 | 13.6/ 66.9 | 28 | 29.51 | 4.82 | 15.1/ 101.0 |
| West Indies | 22 | 29.46 | 4.86 | 16.0/ 56.1 | 20 | 28.12 | 4.80 | 17.3/ 54.6 |
| UAE | 17 | 29.11 | 4.84 | 15.3/ 79.5 | 20 | 29.75 | 4.91 | 15.9/ 94.7 |
For many captains and bowlers, the concern is that four outfielders are too few to protect the boundaries and give the bowlers a realistic chance in the last few overs, when the batting team often has wickets in hand and is on the lookout for quick runs. That's borne out, to an extent at least, in the table below. Since the new rules came into effect, the run rates in the first ten and middle overs haven't changed a whole lot - in fact, the rate in the first ten overs has dropped - but it has lifted in the last ten. That's also the period when the six-hitting rate increased the most, from one every 37 balls in the previous two-year period to one every 26 balls since October 30, 2012. In the India-Australia ODI in Bangalore in November 2013, for example, India scored 151 in the last ten overs, with 14 fours and 11 sixes in 60 balls. A month later, in Johannesburg, India were at the receiving end, as South Africa clobbered 135 in the last ten, including ten sixes and nine fours.
| 0.1 to 10.0 | 10.1 to 40.0 | 40.1 to 50 | ||||
| Run rate | Balls per 4/6 | Run rate | Balls per 4/6 | Run rate | Balls per 4/6 | |
| Oct 30, 2012 onwards | 4.40 | 11.0/ 160.7 | 4.90 | 15.7/ 83.8 | 7.41 | 10.0/ 26.2 |
| Oct 30, 2010 to Oct 29, 2012 | 4.66 | 10.6/ 133.7 | 4.79 | 17.8/ 104.7 | 6.89 | 11.5/ 37.0 |
| Oct 30, 2008 to Oct 29, 2010 | 4.89 | 9.6/ 119.3 | 4.73 | 17.9/ 112.0 | 7.20 | 10.4/ 33.9 |
One of the concerns with this new rule is also that the spinners will suffer due to lack of protection in the deep; mistimed hits will be rewarded with runs, and spinners won't get their just returns despite outfoxing batsmen. That concern too, going by the data available so far, seems a touch exaggerated: the economy rates and averages for spinners haven't changed much since these rules were enforced. They have gone for more sixes, conceding one every 62 from one every 74 earlier, but that hasn't affected their overall economy rate.
During this period Saeed Ajmal has averaged 20.56 runs per wicket at an economy rate of 4.11, conceding only 26 sixes in 2217 balls. Rangana Herath, a spinner who likes to flight the ball, averages 22.05 at an economy rate of 4.20, conceding 15 sixes in 1069 balls. Ravindra Jadeja, a left-arm spinner who like to bowl flatter and quicker, has conceded a six every 55 balls but has a respectable economy rate of 4.47. The field restrictions have been a challenge for the fielding team and especially spin bowlers, but on current evidence it isn't a game-changer; the bowlers, even the spinners, have so far coped reasonably well.
| Period | Average | Econ rate | Dot % | Balls per 4/6 |
| Oct 30, 2012 onwards | 34.04 | 4.72 | 52.6 | 19.1/ 61.9 |
| Oct 30, 2010 to Oct 29, 2012 | 33.67 | 4.63 | 51.2 | 22.3/ 74.0 |
| Oct 30, 2008 to Oct 29, 2010 | 35.78 | 4.71 | 50.4 | 22.0/ 77.7 |
S Rajesh is stats editor of ESPNcricinfo. Follow him on Twitter
Read in App
Elevate your reading experience on ESPNcricinfo App.