New Zealand's middle-order problems
New Zealand seem to have unearthed a solid opening combination, but they'll want more runs from their middle order, which has been the worst among the top teams since 2007
One of the big gains for New Zealand in their home series against England was the unearthing of two solid opening batsmen. Over the last few years, the top two slots have given New Zealand plenty of problems - especially since the retirement of Mark Richardson - which is why it must have been immensely satisfying that New Zealand started the series with an opening partnership of 158, the highest since Trent Bridge 2004, when Richardson and Stephen Fleming added 163. Over the entire series Fulton and Rutherford aggregated 272 for the opening wicket - again the highest series aggregate since the tour to England in 2004 - at an average of 54.40. The return series in England will be an even bigger challenge for the pair and for New Zealand, given that this is the early part of the summer and England's bowlers are particularly adept at bowling with the Dukes ball.
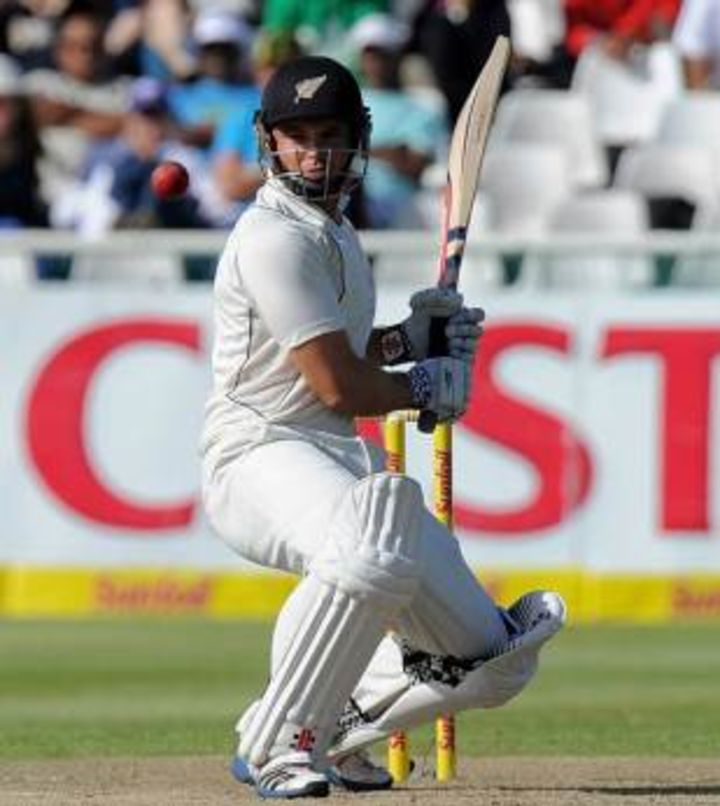
However, along with solid starts, New Zealand will also want more substantial contributions from their middle order, an area which has again been their weakness for a while now. Ross Taylor is obviously their one star player in the middle order, but he has had other issues to sort out, and none of the others have performed consistently over a period of time. Brendon McCullum's form against England was impressive - he had scores of 74, 69, 38 and 67 not out in the four innings, the first time in his career he has scored three 50-plus knocks in a series - but he needs to sustain that consistency, and prove it wasn't a one-off.
In the last six-and-a-half years (since the beginning of 2007), New Zealand's middle order - batsmen from No. 3 to No. 6 - have averaged a mere 33 runs per dismissal, 20 fewer than table-toppers South Africa and at least five-and-a-half runs fewer than all the other top Test teams. Against all opposition excluding Zimbabwe and Bangladesh, that average drops further, to 31.37. The next-lowest among the top teams is Pakistan, with an average of 37.43, more than six runs better than New Zealand's.
New Zealand's lack of centuries has been another prominent issue for them, and it's obvious from the table below that they fare very poorly on this measure too. Against the top sides, South Africa's middle order has scored 59 hundreds in 378 innings, a rate of a hundred every 6.4 innings; New Zealand's middle order has scored one every 21.5 innings. England, their opponents this summer, have 49 centuries in 481 innings, an average of one every 9.8 innings, less than half of New Zealand's average. Pakistan, the team just above them (among the top sides), average 15.7 innings per hundred, almost 27% better than New Zealand's average.
| Versus all teams | Excluding Zim and B'desh | |||||||
| Team | Tests | Inngs | Average | 100s/ 50s | Tests | Inngs | Average | 100s/ 50s |
| South Africa | 61 | 398 | 53.10 | 61/ 76 | 57 | 378 | 53.51 | 59/ 74 |
| Sri Lanka | 55 | 376 | 51.93 | 54/ 68 | 48 | 333 | 48.17 | 41/ 60 |
| India | 70 | 491 | 45.00 | 49/ 106 | 66 | 467 | 43.74 | 42/ 101 |
| Australia | 68 | 479 | 42.15 | 49/ 90 | 68 | 479 | 42.15 | 49/ 90 |
| England | 77 | 504 | 41.81 | 53/ 87 | 73 | 481 | 40.55 | 49/ 82 |
| West Indies | 54 | 372 | 41.14 | 33/ 75 | 46 | 321 | 38.88 | 25/ 66 |
| Pakistan | 46 | 332 | 38.83 | 22/ 67 | 43 | 314 | 37.43 | 20/ 62 |
| Zimbabwe | 8 | 64 | 33.94 | 6/ 8 | 5 | 40 | 23.73 | 1/ 4 |
| New Zealand | 50 | 365 | 33.05 | 18/ 64 | 43 | 323 | 31.37 | 15/ 54 |
| Bangladesh | 35 | 270 | 26.74 | 8/ 35 | 32 | 246 | 26.24 | 8/ 28 |
The only New Zealand middle-order batsman who has played a sufficient number of matches and notched up good numbers during this period is Taylor: he averages 42.55, and has eight centuries in 46 Tests; against the top teams, his stats are similar: an average of 41.06, with seven hundreds in 41 Tests. Even Taylor's series stats aren't consistent: in six of his last eight series he has averaged less than 40; in three of them it's less than 30. One of those lean series was the previous one, against England: in five innings his highest was an unbeaten 41, and his average 23.50.
Among the others, Jesse Ryder has averaged more than 40 overall, and almost 40 against the top sides, but he hasn't played too many games. McCullum averages less than 35, and his numbers are again plagued by inconsistency. Martin Guptill's overall average of 47.27 is the best among all players, but that's entirely due to one Test against Zimbabwe, when Guptill scored 245 runs in the match and was dismissed just once. Exclude that, and his average drops to 27.50.
Among the other players, Daniel Flynn's stats are the most disappointing, because of the number of opportunities he has got. Flynn impressed in his first few series, but since then it's been downhill: he hasn't averaged more than 32 in any of his last six series, and in his last series, in South Africa, he scored 22 in four innings. That meant he hadn't scored a century in 39 innings in the middle order. Not surprisingly, he didn't play the home series against England, and isn't a part of New Zealand's squad to England either.
| Versus all teams | Excluding Zim and B'desh | |||||||
| Batsman | Tests | Runs | Average | 100s/ 50s | Tests | Runs | Average | 100s/ 50s |
| Ross Taylor | 46 | 3362 | 42.55 | 8/ 17 | 41 | 2957 | 41.06 | 7/ 14 |
| Kane Williamson | 23 | 1291 | 33.97 | 3/ 7 | 21 | 1170 | 33.42 | 3/ 6 |
| Jesse Ryder | 18 | 1245 | 41.50 | 3/ 6 | 16 | 1076 | 39.85 | 3/ 5 |
| Brendon McCullum | 20 | 1030 | 34.33 | 0/ 9 | 18 | 937 | 34.70 | 0/ 8 |
| Daniel Flynn | 22 | 879 | 25.85 | 0/ 6 | 20 | 825 | 25.00 | 0/ 6 |
| Daniel Vettori | 12 | 572 | 35.75 | 1/ 3 | 9 | 435 | 36.25 | 1/ 2 |
| Dean Brownlie | 11 | 542 | 36.13 | 1/ 4 | 9 | 479 | 36.84 | 1/ 3 |
| Martin Guptill | 7 | 520 | 47.27 | 1/ 4 | 6 | 275 | 27.50 | 0/ 3 |
Taylor's stats are impressive when compared to his other New Zealand mates, but they pale when compared to the top players worldwide. Among the 17 batsmen who've scored 3000 or more runs in the middle order since the beginning of 2007, Taylor's average is in 16th place, with only Ricky Ponting averaging less than him (40.53).
On top of the pile is Shivnarine Chanderpaul, who averages almost 30 more than Taylor. Kumar Sangakkara and AB de Villiers average in the 60s, while Hashim Amla and Jacques Kallis have identical averages of 57.58. There are also representatives from Australia, India and England in the top ten, while South Africa's batting strength is amply displayed in the table below.
New Zealand have struggled to find such prolific batsmen over the years, but to face up to the challenge in England - and other stiff tests - they'll need a core group of middle-order batsmen who can lift their game and score consistently. Taylor, McCullum, and Kane Williamson have the ability to form that core, but averages in the mid-30s clearly aren't going to do it.
| Batsman | Tests | Runs | Average | 100s/ 50s |
| Shivnarine Chanderpaul | 47 | 4093 | 71.80 | 14/ 21 |
| Kumar Sangakkara | 52 | 5410 | 65.18 | 21/ 20 |
| AB de Villiers | 58 | 4544 | 61.40 | 13/ 22 |
| Hashim Amla | 61 | 5298 | 57.58 | 18/ 25 |
| Jacques Kallis | 58 | 4952 | 57.58 | 20/ 17 |
| Michael Clarke | 66 | 5774 | 55.51 | 19/ 21 |
| Thilan Samaraweera | 42 | 3373 | 54.40 | 9/ 17 |
| Sachin Tendulkar | 64 | 5247 | 51.95 | 16/ 25 |
| Jonathan Trott | 41 | 3205 | 51.69 | 9/ 13 |
| Mahela Jayawardene | 53 | 4517 | 51.32 | 15/ 16 |
S Rajesh is stats editor of ESPNcricinfo. Follow him on Twitter
Read in App
Elevate your reading experience on ESPNcricinfo App.