Shami's ODI success, and England's No. 3 problem
Mohammed Shami has been in excellent ODI form over the last year, but the same can't be said for England's No. 3 batsmen
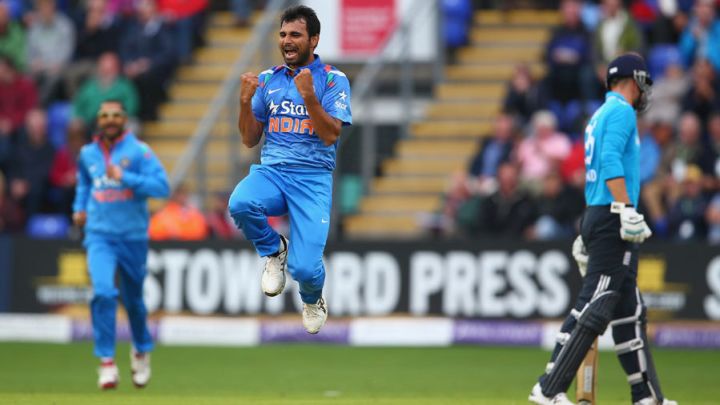
In the first two games that India have played in the World Cup, their batsmen have found spectacular form, scoring more than 300 in each game to set up the wins. However, against most expectations, the bowlers have hit their strides as well, bowling tightly and taking wickets: Pakistan folded for 224, while South African fared even worse, being bundled out for 177. Mohit Sharma and R Ashwin have both taken four wickets in the two games so far, but the stand-out for them has been Mohammed Shami, who followed his 4 for 35 against Pakistan with 2 for 30 against South Africa. In 17 overs in the tournament so far, Shami has figures of 6 for 65, giving him an average of 10.83 and an economy rate of 3.82.
Over the last year, Shami has had an indifferent time in Tests. After a rocking start at home in the two-Test series against West Indies, when he took 11 wickets at an average of 16.54, Shami fell away in conditions in which he should have been even more effective. In the home series he bowled at pace, and swung the ball late, aspects of his bowling that encouraged experts to predict big things for him on tours that were coming up.
Those big things never took place. In two Tests in South Africa, he took six wickets at 43.83; in New Zealand, ten wickets at 35.10; in England, five at 73.20; in Australia, 15 at 35.80. In each of those series, he went at more than three-and-a-half per over as well. Over those four series, Shami was the second-highest wicket-taker for India, but his 36 wickets came at 42.13 runs each, while Ishant Sharma took 43 wickets at 35, and Bhuvneshwar Kumar 20 at 33.70. Shami was also the most expensive of the three, conceding 3.81 runs per over.
The Tests didn't go the way he would have wanted them to, but in ODIs over the same period, Shami has done pretty well. On the tour to England, for example, he took eight wickets in four games, averaging 19 at an economy rate of 4.67. He has generally been more expensive than that, but his ability to take wickets has been a consistent trait, and a huge asset for India.
In the period since January 2014, Shami is the leading wicket-taker among all bowlers, with 46 at an average of 22.50. He has tended to go for runs on a few occasions, but his economy rate of 5.76 isn't that much worse than some of the others in the list below. In terms of averages, only Ajantha Mendis has done better during this period, but no bowler comes close to Shami's five hauls of four or more wickets.
| Player | Mat | Wkts | Average | Econ | SR | 4+ wkts |
| Ajantha Mendis | 17 | 38 | 21.63 | 5.76 | 22.5 | 2 |
| Mohammed Shami | 22 | 46 | 22.50 | 5.76 | 23.4 | 5 |
| Imran Tahir | 19 | 33 | 22.75 | 4.39 | 31.0 | 1 |
| Tim Southee | 16 | 30 | 23.43 | 5.24 | 26.8 | 2 |
| Corey Anderson | 23 | 33 | 25.87 | 6.38 | 24.3 | 2 |
| Dale Steyn | 19 | 30 | 26.00 | 5.01 | 31.1 | 1 |
| Lasith Malinga | 19 | 32 | 27.90 | 5.93 | 28.2 | 3 |
| Chris Woakes | 19 | 32 | 28.65 | 6.01 | 28.5 | 3 |
| Morne Morkel | 20 | 32 | 29.46 | 5.70 | 31.0 | 1 |
| Sachithra Senanayake | 23 | 31 | 29.54 | 4.65 | 38.0 | 1 |
| Chris Jordan | 19 | 30 | 31.40 | 5.74 | 32.8 | 1 |
Shami's new-ball bowling has been alright - ten wickets during this period at an average of 33.30 and an economy rate of 4.75 - but there are others who've done better during that period. James Anderson has 12 wickets at 26.91 and an outstanding economy rate of 3.98, while Vernon Philander and Umesh Yadav both average 22 with the new ball. (Dale Steyn, meanwhile, has only four wickets in the first ten at an average of 66 runs per wicket.)
However, Shami's bigger strength has been his ability to take wickets at the end of an innings. In the last ten overs, he averages 14.80, and has 21 wickets at a strike rate of a wicket every 12 balls. The next highest in terms of wickets is Lasith Malinga with 15 at an average of 14.13 and an economy rate of 6.95. His economy rate of 7.46 isn't the best, but it's pretty acceptable in an age of meaty bats, small boundaries, and batsmen who aim for nothing less than ten an over in the last ten.
With red ball in hand, Shami hasn't lived up to expectations over the last year, with with the white one he has been very good, and his early World Cup form suggests he will be a key bowler for India over the next few weeks.
| Bowler | Inns | Balls | Econ | Wickets | Ave | SR |
| Mohammed Shami | 18 | 250 | 7.46 | 21 | 14.8 | 11.9 |
| SL Malinga | 12 | 183 | 6.95 | 15 | 14.13 | 12.2 |
| MJ McClenaghan | 13 | 159 | 7.05 | 14 | 13.35 | 11.4 |
| BAW Mendis | 13 | 160 | 7.2 | 14 | 13.71 | 11.4 |
| M Morkel | 15 | 188 | 7.34 | 14 | 16.42 | 13.4 |
| TG Southee | 10 | 104 | 6.57 | 12 | 9.5 | 8.7 |
| CR Woakes | 13 | 164 | 9.29 | 12 | 21.16 | 13.7 |
| JP Faulkner | 14 | 208 | 6.92 | 11 | 21.81 | 18.9 |
| MA Starc | 9 | 143 | 5.03 | 11 | 10.9 | 13 |
England's No. 3 worry
Jonathan Trott last played an ODI innings on September 14, 2013. Since then, England's search for a replacement for him at No. 3 in their ODI team has been largely unsuccessful. In the ongoing World Cup, and before that too, England tried Gary Ballance at that position: in eight innings at that position, Ballance has scored 158 runs at an average of 19.75, and a strike rate of 66.1, including identical scores of 10 in each of the three World Cup innings he has played so far.
Over these one-and-a-half years, England are the only team among the top eight sides with no centuries from their No. 3 batsmen, while the average of 22.93 is well below that of the other sides. Among the top eight, Pakistan are just above them, and their No. 3s have averaged 36.22, which is 58% better than England's No. 3 average. India, led by Virat Kohli, average more than 52, while Kane Williamson has been dominant in that position for New Zealand, who average more than 49. Kumar Sangakkara has been the key for Sri Lanka, and Faf du Plessis has done well in that position for South Africa. (Click here for the leading run-scorers in that position since September 15, 2013.)
In 33 innings, England's No. 3s have scored 734 runs, which is only slightly more than half the runs that Kohli has scored in 26 innings in that position during this period (1401). In his last 33 ODI innings at No. 3, Trott scored 1294 runs at an average of 49.76 and a strike rate of 76.52. Among the players they've tried since, James Taylor has had the most success, but England have preferred to play him lower down the order. Getting the No. 3 position sorted will be one of the keys for England if they want to progress deep in the World Cup.
| Team | Inns | Runs | Average | SR | 100 |
| India | 40 | 1825 | 52.14 | 93.44 | 7 |
| New Zealand | 34 | 1526 | 49.22 | 86.02 | 3 |
| Australia | 30 | 1282 | 47.48 | 86.85 | 4 |
| Sri Lanka | 49 | 2063 | 45.84 | 88.12 | 6 |
| South Africa | 37 | 1386 | 38.50 | 85.60 | 4 |
| West Indies | 25 | 818 | 37.18 | 74.63 | 3 |
| Pakistan | 33 | 1123 | 36.22 | 79.64 | 4 |
| Zimbabwe | 19 | 463 | 25.72 | 74.19 | 0 |
| England | 33 | 734 | 22.93 | 70.44 | 0 |
| Bangladesh | 22 | 474 | 21.54 | 79.79 | 0 |
| Player | Inns | Runs | Ave | SR |
| JWA Taylor | 8 | 315 | 45 | 73.25 |
| GS Ballance | 8 | 158 | 19.75 | 66.1 |
| BA Stokes | 4 | 85 | 21.25 | 65.38 |
| IR Bell | 4 | 75 | 18.75 | 86.2 |
| JE Root | 3 | 26 | 8.66 | 38.8 |
S Rajesh is stats editor of ESPNcricinfo. Follow him on Twitter
Read in App
Elevate your reading experience on ESPNcricinfo App.