ODI Outliers: Innings which were way out
A look at ODI batting performances which have dominated the team and opposition innings
Little would Abhishek have realized what he unleashed when he made the comment on Jayasuriya's 189 being more than 50% of the combined team scores. A simple statement. However it opened up a chain reaction of multiple analysis of outlying performances.
I decided to first do the work related to what Abhishek suggested. This is really a player's performance compared with the other 21 players. Then I did some analysis of the player against the 11 players of the other team. Finally there is one analysis of the player compared to the other 10 members of his team. A few very interesting facts have come to light.
First the share of a batsman's score in the aggregate score of the two teams. For this share to be higher than 50%, quite a few factors have to come through. Barring an outrageous scoreline of "Team1: 75 a.o., Team 2: 80 for x (Player1 78)" this can only happen in matches won by the teams batting first. Even there the player has to outscore his own team-mates by a mile, enough to offset the other team score.
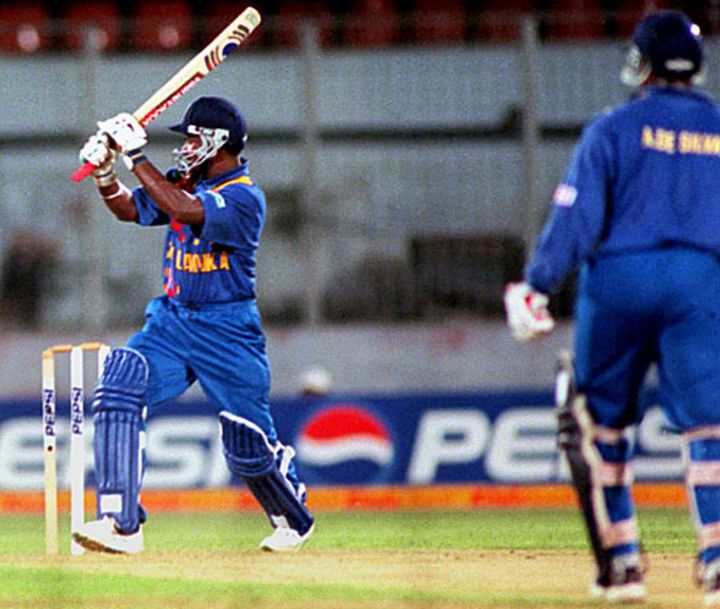
So much so,there is only one case of a player scoring over 50% of the combined match aggregate. That is Jayasuriya, whose 189 formed 53.5% of the total of 353 (299 + 54). Jayasuriya scored 63.2% of his team score and the very low score of India made sure the overall figure remained above 50%. As I have already said, there is necessity for a specific pattern of scores in this analysis. A batsman dominating his own team's innings AND a very low score by the opposing team.
I kept the cut-off at 33.33% and created the table. The table is given below.
SNo MtId Year For Batsman Runs Vs Total Score Share%
1.1652 2000 Slk Jayasuriya S.T 189 vs Ind 353 (299+ 54) 53.54% 2.0264 1984 Win Richards I.V.A 189 vs Eng 440 (272+168) 42.95% 3.2660@2007 Nzl McCullum B.B 80 vs Bng 188 ( 95+ 93) 42.55% 4.1049 1996 Saf Kirsten G 188 vs Uae 473 (321+152) 39.75% 5.0020 1975 Nzl Turner G.M 171 vs Eaf 437 (309+128) 39.13% 6.1943 2003 Zim Wishart C.B 172 vs Nam 444 (340+104) 38.74% 7.0322 1985 Win Haynes D.L 145 vs Nzl 388 (259+129) 37.37% 8.0323@1985 Win Haynes D.L 85 vs Nzl 233 (117+116) 36.48% 9.0405 1986 Win Richardson R.B 109 vs Slk 303 (248+ 55) 35.97% 10.0747@1992 Pak Rameez Raja 119 vs Nzl 333 (167+166) 35.74% 11.2547 2007 Pak Imran Nazir 160 vs Zim 448 (349+ 99) 35.71% 12.2803 2009 Slk Dilshan T.M 137 vs Pak 384 (309+ 75) 35.68% 13.2299@2005 Saf Smith G.C 134 vs Ind 377 (189+188) 35.54% 14.1890 2002 Saf Gibbs H.H 153 vs Bng 434 (301+133) 35.25% 15.2447 2006 Saf Kallis J.H 119 vs Ind 339 (248+ 91) 35.10% 16.0216 1983 Ind Kapil Dev N 175 vs Zim 501 (266+235) 34.93% 17.0441@1987 Win Greenidge C.G 133 vs Nzl 383 (192+191) 34.73% 18.1736 2001 Nzl Astle N.J 117 vs Ind 338 (211+127) 34.62% 19.1832 2002 Pak Mohammad Yousuf 129 vs Slk 373 (295+ 78) 34.58% 20.0015@1974 Pak Zaheer Abbas 57 vs Eng 165 ( 84+ 81) 34.55% 21.2912 2009 Zim Masakadza H 178 vs Ken 516 (329+187) 34.50% 22.1964 2003 Ind Tendulkar S.R 152 vs Nam 441 (311+130) 34.47% 23.2088 2004 Saf Kallis J.H 109 vs Win 317 (263+ 54) 34.38% 24.0457 1987 Win Richards I.V.A 181 vs Slk 529 (360+169) 34.22% 25.2828@2009 Win Gayle C.H 80 vs Eng 234 (117+117) 34.19% 26.0549 1989 Aus Marsh G.R 125 vs Pak 366 (258+108) 34.15% 27.2427 2006 Bng Shahriar Nafees 123 vs Zim 361 (231+130) 34.07% 28.1981 2003 Win Gayle C.H 119 vs Ken 350 (246+104) 34.00% 29.1837@2002 Win Gayle C.H 84 vs Ind 247 (124+123) 34.01% 30.0638 1990 Pak Rameez Raja 114 vs Nzl 341 (223+118) 33.43% Note: @ indicates second innings.
Next to Jayasuriya's 189 is the other 189, almost certainly the greatest ODI innings played. By Viv Richards, whose 189 (out of 272+168) formed 42.95% of the aggregate. However the most breath-taking of the chasing innings of all, McCullum's 80 (out of 93+95) formed 42.55% of the aggregate. This bizarre (real-life) scoreline is almost close to the outrageous scoreline I had earlier talked about. For a near-100 target to be chased by a team and one batsman scoring over 84% is unreal. No other innings exceeds 40% of the aggregate. The next chasing innings is Haynes's 85 (out of 116+117) working out to 36.5%.
It is not surprising that 9 West Indian batsmen figure in this list. Gayle is the leading batsman with 3 such dominating performances. In general the top three batsmen dominate the table. It is surprising that there is a single Australian entry (that too from Geoff Marsh) and nothing from England.
The next set of outlier innings are the ones where a batsman has outscored the other team by a wide margin. Note the clear distinction. In the first one we looked at the share of the batsman out of the aggregate. Here we look at the factor by which he outscored the opponents. Let us look at the table.
SNo MtId Year For Batsman            Runs  Vs    Score Ratio1.1652 2000 Slk Jayasuriya S.T      189 vs Ind  54/10 3.50
2.2088 2004 Saf Kallis J.H          109 vs Win  54/10 2.02
3.0405 1986 Win Richardson R.B      109 vs Slk  55/10 1.98
4.1970 2003 Aus Hayden M.L           88 vs Nam  45/10 1.96
5.2803 2009 Slk Dilshan T.M         137 vs Pak  75/10 1.83
6.1943 2003 Zim Wishart C.B         172 vs Nam 104/ 5 1.65
7.1832 2002 Pak Mohammad Yousuf     129 vs Slk  78/10 1.65
8.2547 2007 Pak Imran Nazir         160 vs Zim  99/10 1.62
9.2727 2008 Nzl McCullum B.B        166 vs Ire 112/10 1.48
10.2727 2008 Nzl Marshall J.A.H      161 vs Ire 112/10 1.44
11.1868 2002 Aus Hayden M.L          146 vs Pak 108/10 1.35
12.2001 2003 Ind Yuvraj Singh        102 vs Bng  76/10 1.34
13.0020 1975 Nzl Turner G.M          171 vs Eaf 128/ 8 1.34
14.1970 2003 Aus Symonds A            59 vs Nam  45/10 1.31
15.2447 2006 Saf Kallis J.H          119 vs Ind  91/10 1.31
16.0297 1985 Aus Border A.R          118 vs Slk  91/10 1.30
17.1049 1996 Saf Kirsten G           188 vs Uae 152/ 8 1.24
18.0405 1986 Win Greenidge C.G        67 vs Slk  55/10 1.22
19.0777 1992 Win Haynes D.L           96 vs Pak  81/10 1.19
20.1964 2003 Ind Tendulkar S.R       152 vs Nam 130/10 1.17
Here also Jayasuriya's 189 rules the roost. This innings was 3.5 times the Indian score of 54. Then, after a mile or two, comes Kallis's 109 against the West Indian score of 54, a factor of 2.02. These are the only two innings with a factor above 2.0. That puts the Jayasuriya innings in perspective. Readers can note how quickly the factor drops off. Needless to say that all these innings are when the team batting first wins.
In general the weaker teams have been at the receiving end. It is of interest that Sri Lanka has figured prominently at either end. For the few matches Namibia has played (6), they have been the victims 5 times (by two batsmen in a single match).
Now for the third analysis. This time against the batsman's own team mates. Taking the runs only would be quite silly since many a batsman has out-scored his team mates. Hence I have taken the scoring rate as the basis. I determined the following ratio and then ranked the players on that ratio.
Batsman's own scoring rate
Batsman outlier ratio = -------------------------------
Rest of the team's scoring rate
In order to avoid getting in a batsman scoring 10 in 2 balls and "outscoring" the rest of his team by a wide margin, I selected only innings of 50 and above. Also I have excluded the team extras from the rest of the team runs to be completely correct. Now for the table.
No MtId Year For Batsman            Vs  Score   S/R   Others  S/R Ratio1.1093 1996 Slk Jayasuriya S.T    Pak  76( 28) 2.71  81(169) 0.48 5.66
2.0182 1983 Nzl Cairns B.L        Aus  52( 25) 2.08  92(214) 0.43 4.84
3.0657 1990 Slk Ranatunga A       Ind  58( 27) 2.15 135(267) 0.51 4.25
4.0152 1982 Ind Kapil Dev N       Eng  60( 37) 1.62 115(293) 0.39 4.13
5.3039 2010 Nzl Mills K.D         Ind  52( 35) 1.49  53(146) 0.36 4.09
6.0225 1983 Ind Patil S.M         Pak  51( 28) 1.82 106(216) 0.49 3.71
7.0053 1978 Nzl Cairns B.L        Eng  60( 43) 1.40  79(205) 0.39 3.62
8.0216 1983 Ind Kapil Dev N       Zim 175(138) 1.27  79(222) 0.36 3.56
9.0576 1989 Aus Border A.R        Eng  84( 44) 1.91 140(256) 0.55 3.49
10.2365 2006 Aus Gilchrist A.C     Bng  76( 46) 1.65 103(218) 0.47 3.50
11.1901 2002 Zim Ervine S.M        Pak  61( 41) 1.49  67(157) 0.43 3.49
12.0608 1990 Pak Wasim Akram       Aus  86( 76) 1.13  69(211) 0.33 3.46
13.1660 2000 Ind Agarkar A.B       Zim  67( 25) 2.68 213(275) 0.77 3.46
14.2239 2005 Pak Shahid Afridi     Ind 102( 46) 2.22 134(207) 0.65 3.43
15.2687 2008 Aus Gilchrist A.C     Slk  83( 50) 1.66 116(239) 0.49 3.42
16.2252 2005 Bng Mohammad Ashraful Eng  94( 52) 1.81 117(220) 0.53 3.40
17.0015 1974 Pak Zaheer Abbas      Eng  57( 61) 0.93  13( 47) 0.28 3.38
18.1963 2003 Can Davison J.M       Win 111( 76) 1.46  79(181) 0.44 3.35
19.2638 2007 Ber Cann L.O.B        Ken  52( 32) 1.62 106(216) 0.49 3.31
20.0245 1984 Win Holding M.A       Aus  64( 39) 1.64 110(222) 0.50 3.31
21.2660 2007 Nzl McCullum B.B      Bng  80( 28) 2.86   7(  8) 0.88 3.27
22.2875 2009 Can Rizwan Cheema     Ken  76( 38) 2.00  37( 60) 0.62 3.24
23.0547 1989 Pak Imran Khan        Win  67( 41) 1.63 132(259) 0.51 3.21
24.2752 2008 Can Rizwan Cheema     Win  61( 45) 1.36 102(236) 0.43 3.14
25.0481 1987 Ind Kapil Dev N       Win  87( 64) 1.36  89(204) 0.44 3.12
26.1864 2002 Pak Shahid Afridi     Saf  62( 40) 1.55 125(251) 0.50 3.11
27.2059 2003 Eng Flintoff A        Bng  70( 47) 1.49  57(119) 0.48 3.11
28.0221 1983 Ind Patil S.M         Eng  51( 32) 1.59 152(296) 0.51 3.11
29.2828 2009 Win Gayle C.H         Eng  80( 43) 1.86  27( 45) 0.60 3.11
30.0622 1990 Aus Jones D.M         Nzl 102( 91) 1.12  52(144) 0.36 3.11
31.2980 2010 Win Sammy D.J.G       Saf  58( 24) 2.42 206(265) 0.78 3.11
32.0344 1985 Win Richards I.V.A    Pak  66( 39) 1.69 111(201) 0.55 3.06
33.1814 2002 Zim Marillier D.A     Ind  56( 24) 2.33 209(274) 0.76 3.06
34.2735 2008 Ind Sehwag V          Slk  60( 36) 1.67 110(201) 0.55 3.05
35.2584 2007 Pak Shahid Afridi     Slk  73( 34) 2.15 156(218) 0.72 3.00
Ah! how can you get this guy off the top. This is the third time, out of three, in this article that the "Matara marauder" has been at the top. At least it is for a different innings. His 76 in 28 balls against Pakistan had a scoring rate of 2.71 and the rest of his team scored at 0.48, giving this innings the stupendous ratio of 5.66. Then comes "father" Cairns whose 52 in 25 balls was scored 4.84 times faster than his team mates. Ranatunga's 58 in 27 balls gives this innings a ratio of 4.25. The century with the highest ratio is for Kapil Dev's 175 which scores 3.56. Anything said about this gem is an under-statement Afridi's 102 comes in next, clocking in at 3.43.
Holding deserves a special mention. His 64 off 39 balls compared to his team total of 197 in 43.3 overs is one of only two instances of a bowler in this exalted company. It is all the more commendable since the other teams included the greats and the bowling was Lawson/Alderman/Hogg/Rackemann. Kyle's 52 also deserves equal credit. Also spare a thought for L'O.B Cann, playing for unfancied Bermuda.
Overall it can be said that Sri Lanka and West Indies have often been at either end of the spectrum. English batsmen have rarely figured in such dominating innings. Also, with Gilchrist at the top, Australia has not appeared that frequently as expected.
This only shows the influence Jayasuriya had on the game. He outscored 21 other players, outscored 11 of his opposite team players by a factor of 3.50 and scored at a rate 5.66 times that of his 10 team-mates. He comes through on top on all three measures. Also note the daylight which exists between Jayasuriya and the second placed innings in the first two tables. When we talk of the greatest ODI players we almost always talk of Tendulkar and Richards. I think Jayasuriya needs to be included in this company.
It should be noted that these differ from the "PIF" based on the "Alex Factor" quite a lot although the third one comes near that analysis.
My thanks to Abhishek for providing the spark.