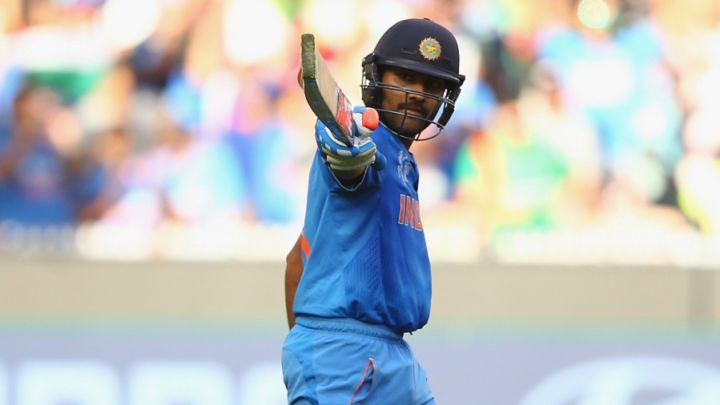
Rohit Sharma's hundred at No. 3
An analysis of performances in the World Cup after the second quarter-final of the World Cup
This analysis will be done at suitable points during the World Cup 2015 so that the readers can see the way the Performance tables evolve. As more matches get played the top performance mosaic changes and readers can identify with what happened in the past few days. The qualifying bar for inclusion moves higher as more matches get played.
Two fairly one-sided matches in the quarter-finals. Unlike Sri Lanka, Bangladesh were in the game for some time, during about 25 overs in the Indian innings. But for a highly dubious no-ball call by the umpire and a hair's-breadth escape of the Lbw appeal, they could have done more. But, as expected, India proved too strong. India has shown that they could recover from top-order failures with middle-order recoveries. However, it is quite doubtful if they can move a scoring rate of around 4 runs an over to 6 in 20 overs, against the likes of Mithcell Starc, Dale Steyn and Trent Boult.
| SNo | Rating Pts | Year | ODI# | MatchIdx# | Batsman | For | Vs | Runs | Balls |
|---|---|---|---|---|---|---|---|---|---|
| 1 | 579 | 2015 | 3616 | 100 | AB de Villiers | South Africa | Win | 162* | 66 |
| 2 | 573 | 2015 | 3612 | 100 | CH Gayle | West Indies | Zim | 215 | 147 |
| 3 | 469 | 2015 | 3641 | 111 | RG Sharma | India | Bng | 137 | 126 |
| 4 | 461 | 2015 | 3615 | 100 | TM Dilshan | Sri Lanka | Bng | 161* | 146 |
| 5 | 459 | 2015 | 3610 | 100 | S Dhawan | India | Saf | 137 | 146 |
| 6 | 454 | 2015 | 3636 | 100 | BRM Taylor | Zimbabwe | Ind | 138 | 110 |
| 7 | 448 | 2015 | 3623 | 100 | DA Warner | Australia | Afg | 178 | 133 |
| 8 | 442 | 2015 | 3624 | 100 | KJ Coetzer | Scotland | Bng | 156 | 134 |
| 9 | 428 | 2015 | 3634 | 100 | Mahmudullah | Bangladesh | Nzl | 128* | 123 |
| 10 | 397 | 2015 | 3601 | 100 | DA Miller | South Africa | Zim | 138* | 92 |
Rohit Sharma's very effective innings of 137, at a good pace, has broken into the third place in the batting performance table. While the higher match index certainly helped, it was still a high quality innings against an under-rated bowling attack and might have been in the top-10 anyhow..
| SNo | Rating Pts | Year | ODI# | MatchIdx# | Bowler | For | Vs | Analysis |
|---|---|---|---|---|---|---|---|---|
| 1 | 671 | 2015 | 3617 | 100 | MA Starc | Australia | Nzl | 9.0 - 0 - 28 - 6 |
| 2 | 598 | 2015 | 3607 | 100 | TG Southee | New Zealand | Eng | 9.0 - 0 - 33 - 7 |
| 3 | 492 | 2015 | 3617 | 100 | TA Boult | New Zealand | Aus | 10.0 - 3 - 27 - 5 |
| 4 | 445 | 2015 | 3600 | 100 | MR Marsh | Australia | Eng | 9.0 - 0 - 33 - 5 |
| 5 | 430 | 2015 | 3602 | 100 | Sohail Khan | Pakistan | Ind | 10.0 - 0 - 55 - 5 |
| 6 | 356 | 2015 | 3616 | 100 | Imran Tahir | South Africa | Win | 10.0 - 2 - 45 - 5 |
| 7 | 348 | 2015 | 3640 | 111 | Imran Tahir | South Africa | Slk | 8.2 - 0 - 26 - 4 |
| 8 | 335 | 2015 | 3620 | 100 | Mohammad Irfan | Pakistan | Zim | 10.0 - 2 - 30 - 4 |
| 9 | 321 | 2015 | 3621 | 100 | KJ Abbott | South Africa | Ire | 8.0 - 0 - 21 - 4 |
| 10 | 321 | 2015 | 3608 | 100 | JE Taylor | West Indies | Pak | 7.0 - 1 - 15 - 3 |
Again, no bowling performance of note. So the table remains unchanged. Umesh Yadav's wickets were not of high quality batsmen. The low averages of the Bangladesh batsmen and the cushion of a 300-plus score did not help much.
| SNo | Rating Pts | Year | ODI# | MatchIdx# | Player | For | Vs | Runs | Balls | Analysis |
|---|---|---|---|---|---|---|---|---|---|---|
| 1 | 700 | 2015 | 3612 | 100 | CH Gayle | West Indies | Zim | 215 | 147 | 6.0-0-35-2 |
| 2 | 579 | 2015 | 3615 | 100 | TM Dilshan | Sri Lanka | Bng | 161* | 146 | 8.0-0-35-2 |
| 3 | 496 | 2015 | 3600 | 100 | MR Marsh | Australia | Eng | 23 | 20 | 9.0-0-33-5 |
| 4 | 447 | 2015 | 3620 | 100 | Wahab Riaz | Pakistan | Zim | 54* | 46 | 9.4-1-45-4 |
| 5 | 434 | 2015 | 3611 | 100 | MM Ali | England | Sco | 128 | 107 | 10.0-0-47-2 |
| 6 | 403 | 2015 | 3627 | 100 | SC Williams | Zimbabwe | Ire | 96 | 83 | 9.0-0-72-3 |
| 7 | 363 | 2015 | 3634 | 100 | Shakib Al Hasan | Bangladesh | Nzl | 23 | 18 | 8.5-1-55-4 |
| 8 | 353 | 2015 | 3608 | 100 | AD Russell | West Indies | Pak | 42* | 13 | 8.0-2-33-3 |
| 9 | 345 | 2015 | 3638 | 100 | Amjad Javed | U.A.E. | Win | 56 | 99 | 8.0-0-29-2 |
| 10 | 311 | 2015 | 3614 | 100 | RD Berrington | Scotland | Afg | 25 | 46 | 10.0-0-40-4 |
No all-round performance of note. So the table remains unchanged.
| SNo | Rating Pts | Year | ODI# | MatchIdx# | Team | Own score | Vs | Other score |
|---|---|---|---|---|---|---|---|---|
| 1 | 750 | 2015 | 3640 | 111 | South Africa | 134 for 1 in 18.0 | Slk | 133 for 10 in 37.2 |
| 2 | 721 | 2015 | 3616 | 100 | South Africa | 408 for 5 in 50.0 | Win | 151 for 10 in 33.1 |
| 3 | 714 | 2015 | 3607 | 100 | New Zealand | 125 for 2 in 12.2 | Eng | 123 for 10 in 33.2 |
| 4 | 690 | 2015 | 3610 | 100 | India | 307 for 7 in 50.0 | Saf | 177 for 10 in 40.2 |
| 5 | 688 | 2015 | 3623 | 100 | Australia | 417 for 6 in 50.0 | Afg | 142 for 10 in 37.3 |
| 6 | 678 | 2015 | 3621 | 100 | South Africa | 411 for 4 in 50.0 | Ire | 210 for 10 in 45.0 |
| 7 | 669 | 2015 | 3631 | 100 | India | 260 for 2 in 36.5 | Ire | 259 for 10 in 49.0 |
| 8 | 668 | 2015 | 3635 | 100 | England | 101 for 1 in 18.1 | Afg | 111 for 7 in 36.2 |
| 9 | 666 | 2015 | 3608 | 100 | West Indies | 310 for 6 in 50.0 | Pak | 160 for 10 in 39.0 |
| 10 | 664 | 2015 | 3618 | 100 | India | 104 for 1 in 18.5 | Uae | 102 for 10 in 31.3 |
India's comfortable win against Bangladesh in their quarter-final match was not big enough to enter into the top-10 table. Even with the higher match index, this win fetched 649 rating points and did not meet the cut-off.
A brief introduction into the methodology of Performance Analysis.
The Batting Performance Ratings analysis takes into account the Runs scored, Balls faced, Next highest score (if this is the highest score), % of Team score, Innings status at entry, Bowling quality, Pitch information, Team strengths, Target score in front, Match location, Result and Match importance. These parameters are given appropriate weights. The calculations are done in such a way that Rating points of 1000 would be allotted to a mind-blowing and match-winning score of 200 in 150 balls in a WC final.
The Bowling Performance Ratings analysis takes into account the Wickets captured, Quality of batsmen dismissed, Scores at which batsmen were dismissed, Bowling accuracy, Batting quality, Pitch information, Team strengths, Target being defended, Match location, Result and Match importance. The calculations are done in such a way that Rating points of 1000 would be allotted to a magnificent and match-winning analysis of 10-2-15-6 in a WC final.
The Player Performance Ratings analysis takes into account the Batting Rating points, Bowling Rating points and the Fielding Rating points, which is a combination of catches and stumpings. There are minimum criteria for batting and bowling stints to ensure that these are genuinely all-round performances.
The Team Performance Ratings analysis takes into account the Result, Margin of win, Resources utilized, Team strengths, Match location and Match importance. The calculations are done in such a way that Rating points of 1000 would be allotted to an overwhelming win by 150 runs or 8 wickets in a WC final.
Anantha Narayanan has written for ESPNcricinfo and CastrolCricket and worked with a number of companies on their cricket performance ratings-related systems
Read in App
Elevate your reading experience on ESPNcricinfo App.