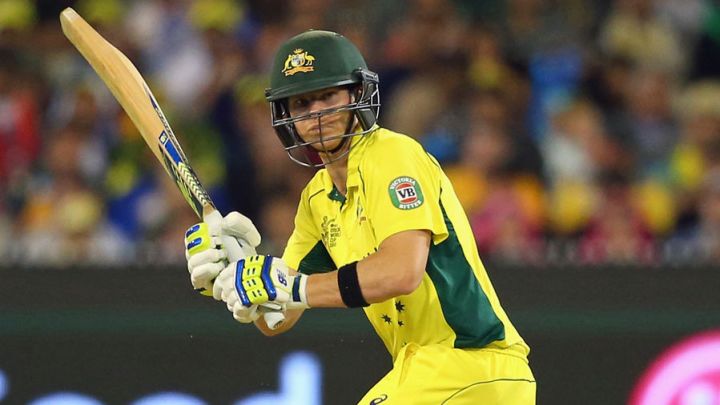
Smith's century at No.8
An analysis of performances in the World Cup after the second semi-final of the World Cup
This analysis will be done at suitable points during the World Cup 2015 so that the readers can see the way the Performance tables evolve. As more matches get played the top performance mosaic changes and readers can identify with what happened in the past few days. The qualifying bar for inclusion moves higher as more matches get played.
I had pencilled this match as an overall 60-40 for Australia. Unfortunately the Indian supporters, media and even the former knowledgeable players had let their enthusiasm override common sense and it was a surprise to see the normally balanced Rahul Dravid and Sourav Ganguly pinning the match at 50-50 even after the toss. By that time I had made the match 70-30 for Australia. Their bowling could have defended 270 runs comfortably. Despite losing about 30 runs in the middle overs, Australia won by nearly 100 runs.
| SNo | Rating Pts | Year | ODI# | MatchIdx# | Batsman | For | Vs | Runs | Balls |
|---|---|---|---|---|---|---|---|---|---|
| 1 | 833 | 2015 | 3643 | 111 | MJ Guptill | New Zealand | Win | 237* | 163 |
| 2 | 579 | 2015 | 3616 | 100 | AB de Villiers | South Africa | Win | 162* | 66 |
| 3 | 573 | 2015 | 3612 | 100 | CH Gayle | West Indies | Zim | 215 | 147 |
| 4 | 469 | 2015 | 3641 | 111 | RG Sharma | India | Bng | 137 | 126 |
| 5 | 461 | 2015 | 3615 | 100 | TM Dilshan | Sri Lanka | Bng | 161* | 146 |
| 6 | 459 | 2015 | 3610 | 100 | S Dhawan | India | Saf | 137 | 146 |
| 7 | 454 | 2015 | 3636 | 100 | BRM Taylor | Zimbabwe | Ind | 138 | 110 |
| 8 | 448 | 2015 | 3645 | 125 | SPD Smith | Australia | Ind | 105 | 93 |
| 9 | 447 | 2015 | 3623 | 100 | DA Warner | Australia | Afg | 178 | 133 |
| 10 | 442 | 2015 | 3624 | 100 | KJ Coetzer | Scotland | Bng | 156 | 134 |
Steven Smith's excellent innings gathered just enough points to get into the table in the eighth position with 448 points. Let me say that this was a surprise for me since I felt that his dismissal just after he crossed 100 would hurt him a bit. But the scoring rate and the good quality of Indian bowling helped.
| SNo | Rating Pts | Year | ODI# | MatchIdx# | Bowler | For | Vs | Analysis |
|---|---|---|---|---|---|---|---|---|
| 1 | 679 | 2015 | 3617 | 100 | MA Starc | Australia | Nzl | 9.0 - 0 - 28 - 6 |
| 2 | 598 | 2015 | 3607 | 100 | TG Southee | New Zealand | Eng | 9.0 - 0 - 33 - 7 |
| 3 | 493 | 2015 | 3617 | 100 | TA Boult | New Zealand | Aus | 10.0 - 3 - 27 - 5 |
| 4 | 445 | 2015 | 3600 | 100 | MR Marsh | Australia | Eng | 9.0 - 0 - 33 - 5 |
| 5 | 430 | 2015 | 3602 | 100 | Sohail Khan | Pakistan | Ind | 10.0 - 0 - 55 - 5 |
| 6 | 361 | 2015 | 3643 | 111 | TA Boult | New Zealand | Win | 10.0 - 3 - 44 - 4 |
| 7 | 355 | 2015 | 3616 | 100 | Imran Tahir | South Africa | Win | 10.0 - 2 - 45 - 5 |
| 8 | 348 | 2015 | 3640 | 111 | Imran Tahir | South Africa | Slk | 8.2 - 0 - 26 - 4 |
| 9 | 335 | 2015 | 3620 | 100 | Mohammad Irfan | Pakistan | Zim | 10.0 - 2 - 30 - 4 |
| 10 | 329 | 2015 | 3642 | 111 | JR Hazlewood | Australia | Pak | 10.0 - 1 - 35 - 4 |
No single great bowling performance in the semi-final. Umesh Yadav secured 311 rating points. Let us not forget that India lost the match.
| SNo | Rating Pts | Year | ODI# | MatchIdx# | Player | For | Vs | Runs | Balls | Analysis |
|---|---|---|---|---|---|---|---|---|---|---|
| 1 | 700 | 2015 | 3612 | 100 | CH Gayle | West Indies | Zim | 215 | 147 | 6.0-0-35-2 |
| 2 | 579 | 2015 | 3615 | 100 | TM Dilshan | Sri Lanka | Bng | 161* | 146 | 8.0-0-35-2 |
| 3 | 496 | 2015 | 3600 | 100 | MR Marsh | Australia | Eng | 23 | 20 | 9.0-0-33-5 |
| 4 | 447 | 2015 | 3620 | 100 | Wahab Riaz | Pakistan | Zim | 54* | 46 | 9.4-1-45-4 |
| 5 | 434 | 2015 | 3611 | 100 | MM Ali | England | Sco | 128 | 107 | 10.0-0-47-2 |
| 6 | 403 | 2015 | 3627 | 100 | SC Williams | Zimbabwe | Ire | 96 | 83 | 9.0-0-72-3 |
| 7 | 364 | 2015 | 3634 | 100 | Shakib Al Hasan | Bangladesh | Nzl | 23 | 18 | 8.5-1-55-4 |
| 8 | 356 | 2015 | 3644 | 125 | CJ Anderson | New Zealand | Saf | 58 | 57 | 6.0-0-72-3 |
| 9 | 353 | 2015 | 3608 | 100 | AD Russell | West Indies | Pak | 42* | 13 | 8.0-2-33-3 |
| 10 | 344 | 2015 | 3638 | 100 | Amjad Javed | U.A.E. | Win | 56 | 99 | 8.0-0-29-2 |
Johnson 260 points for his cameo and two important wickets but missed the cut-off.
| SNo | Rating Pts | Year | ODI# | MatchIdx# | Team | Own score | Vs | Other score |
|---|---|---|---|---|---|---|---|---|
| 1 | 750 | 2015 | 3640 | 111 | South Africa | 134 for 1 in 18.0 | Slk | 133 for 10 in 37.2 |
| 2 | 721 | 2015 | 3616 | 100 | South Africa | 408 for 5 in 50.0 | Win | 151 for 10 in 33.1 |
| 3 | 714 | 2015 | 3607 | 100 | New Zealand | 125 for 2 in 12.2 | Eng | 123 for 10 in 33.2 |
| 4 | 690 | 2015 | 3610 | 100 | India | 307 for 7 in 50.0 | Saf | 177 for 10 in 40.2 |
| 5 | 688 | 2015 | 3623 | 100 | Australia | 417 for 6 in 50.0 | Afg | 142 for 10 in 37.3 |
| 6 | 678 | 2015 | 3621 | 100 | South Africa | 411 for 4 in 50.0 | Ire | 210 for 10 in 45.0 |
| 7 | 671 | 2015 | 3645 | 125 | Australia | 328 for 7 in 50.0 | Ind | 233 for 10 in 46.5 |
| 8 | 669 | 2015 | 3631 | 100 | India | 260 for 2 in 36.5 | Ire | 259 for 10 in 49.0 |
| 9 | 668 | 2015 | 3635 | 100 | England | 101 for 1 in 18.1 | Afg | 111 for 7 in 36.2 |
| 10 | 666 | 2015 | 3608 | 100 | West Indies | 310 for 6 in 50.0 | Pak | 160 for 10 in 39.0 |
The importance of the match, size of win and the quality of Indian batting got, the semi-final win got Australia 671 rating points and got them into the seventh position. They batted very well, despite the 7-over wobble in the middle and bowled with a lot more fire and intent.
A brief introduction into the methodology of Performance Analysis.
The Batting Performance Ratings analysis takes into account the Runs scored, Balls faced, Next highest score (if this is the highest score), % of Team score, Innings status at entry, Bowling quality, Pitch information, Team strengths, Target score in front, Match location, Result and Match importance. These parameters are given appropriate weights. The calculations are done in such a way that Rating points of 1000 would be allotted to a mind-blowing and match-winning score of 200 in 150 balls in a WC final.
The Bowling Performance Ratings analysis takes into account the Wickets captured, Quality of batsmen dismissed, Scores at which batsmen were dismissed, Bowling accuracy, Batting quality, Pitch information, Team strengths, Target being defended, Match location, Result and Match importance. The calculations are done in such a way that Rating points of 1000 would be allotted to a magnificent and match-winning analysis of 10-2-15-6 in a WC final.
The Player Performance Ratings analysis takes into account the Batting Rating points, Bowling Rating points and the Fielding Rating points, which is a combination of catches and stumpings. There are minimum criteria for batting and bowling stints to ensure that these are genuinely all-round performances.
The Team Performance Ratings analysis takes into account the Result, Margin of win, Resources utilized, Team strengths, Match location and Match importance. The calculations are done in such a way that Rating points of 1000 would be allotted to an overwhelming win by 150 runs or 8 wickets in a WC final.
Anantha Narayanan has written for ESPNcricinfo and CastrolCricket and worked with a number of companies on their cricket performance ratings-related systems
Read in App
Elevate your reading experience on ESPNcricinfo App.