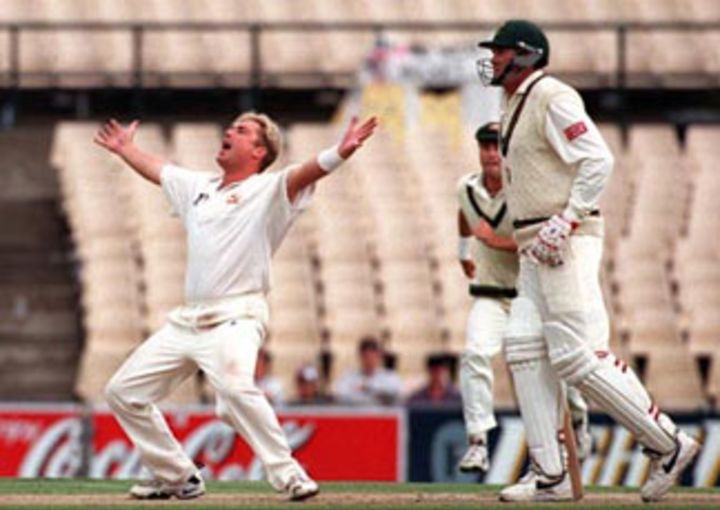
Warne's influence massive
While the contest has been much more balanced in recent years, Australia's extraordinary dominance between 1993 and 2006 had much to do with the presence of Shane Warne
In recent years, Australia-South Africa Tests have been the most enthralling contests with the teams splitting the last eight matches 4-4. Perhaps the best feature of the match-up is the relatively low percentage of draws (15.62% since 1993). With both countries producing result-oriented pitches and the teams playing aggressive cricket, a stalemate has been virtually out of question. In the last 20 Test matches played between the teams since the start of 2000, only one match has been drawn. Taking advantage of the transition Australia were going through in 2008, South Africa won their first series against Australia 2-1 with victories in Perth and Melbourne. Australia, however, hit right back winning the return series in South Africa 2-1. The previous series between the two teams (in 2011), which was restricted to just two Tests, ended 1-1 with Australia chasing a record 310 in Johannesburg after their inexplicable collapse in the first Test in Cape Town.
Australia well ahead overall
South Africa's recent display in England has seen them rise to the top of the Test rankings once again. Remarkably, their last series defeat outside home came in 2006. However, they have failed to dominate Australia similarly despite Australia's form dropping considerably in the last four years. While the teams are locked 4-4 in their last three series, Australia have held the whip in home and away series between 1993 and 2006. The teams drew their first two series 1-1 with South Africa sneaking a stunning five-run win in Sydney (1994) defending a target of 117. Australia followed up an outstanding performance in South Africa (1997), where they went on to win the series 2-1, with a 1-0 win at home later in the year. The highlights of the series in South Africa included the record 385-run stand between Greg Blewett (214) and Steve Waugh (160) in Johannesburg and Mark Waugh's brilliant 116 that enabled Australia chase down a tough target of 270 in Port Elizabeth. Between then and 2006, it was one-way traffic with Australia bossing each of the four subsequent series.
In 2001-02, Steve Waugh's team triumphed 3-0 at home and 2-1 in South Africa. The series in South Africa was dominated by Adam Gilchrist who scored 473 runs in the three Tests including 204 and 138 in the first two Tests. Ricky Ponting was in top form in the 2005 series in Australia as he led the team to a 2-0 win with two centuries in his 100th Test in Sydney as Australia overhauled the 287-run target with ease. The world-beating Australian outfit followed this up with a 3-0 whitewash in South Africa. Australia's 10-1 record in the period 2000-2006 is comparable to their dominant run against South Africa in the years before the Second World War when they won 18 and lost just one of 24 matches. South Africa, however, proved to be a far tougher unit in the 1950s and 1960s winning 10 and losing 11 matches. South Africa's finest moment came in their final series before the ban (in 1969-70) when Ali Bacher led a star-studded team to a 4-0 whitewash of Bill Lawry's Australian team. Overall though, Australia are well ahead on the head-to-head front and boast a win-loss ratio of 2.52 (48 wins and 19 losses). Although the draw percentage across the 85 Tests is low (21.17%), it is still higher than the corresponding number since South Africa's readmission (15.62%).
| Period | Matches | Wins | Losses | Draws | % draws | W/L ratio |
| Overall | 85 | 48 | 19 | 18 | 21.17 | 2.52 |
| Pre World War 2 | 24 | 18 | 1 | 5 | 20.83 | 18.00 |
| 1946-1970 | 29 | 11 | 10 | 8 | 27.58 | 1.10 |
| 1992-present | 32 | 19 | 8 | 5 | 15.62 | 2.37 |
| In Australia (post 1992) | 15 | 8 | 3 | 4 | 26.66 | 2.66 |
| In South Africa (post 1992) | 17 | 11 | 5 | 1 | 5.88 | 2.20 |
The Warne factor
Both Australia and South Africa have traditionally fielded top-quality pace attacks and the stats prove the same. South Africa's bowlers have picked up more wickets in Australia (181) but have been far more expensive averaging 37.04 compared to Australia's 31.66. In South Africa too, Australia's pace bowlers have done better picking up 195 wickets at 28.78 while South Africa's fast bowlers have managed 221 wickets at 33.04. South Africa's pace bowlers have picked up more five-fors in Australia but have been upstaged in this regard in home Tests. The biggest difference between the two teams in the period since South Africa's return has been the presence of Shane Warne in the Australian team. Warne, the most successful bowler against South Africa, with 130 wickets dominated the contests picking up seven five-wicket hauls and two ten-wicket match hauls. He was equally prolific in home and away Tests though five of his seven five-fors came in Australia. South Africa's biggest problem over the years has been the lack of a match-winning spinner. The gulf in the quality of spinners is reflected clearly in the bowling stats. While Australia average 31.18 and 26.13 in Australia and South Africa respectively, the corresponding averages are 48.92 and 41.00 for South Africa. While Australian spinners have contributed nearly 36% of the wickets (only wickets taken by pace and spin bowlers), the South African spinners are way behind contributing just 17.28% of the total wickets.
| Team | Wickets/avg (in Australia) | 5WI/10WM (in Australia) | Wickets/avg (in South Africa) | 5WI/10WM (in South Africa) | Wickets/avg (overall) | 5WI/10WM (overall) |
| Australia (pace) | 133/31.66 | 3/1 | 195/28.78 | 8/0 | 328/29.95 | 11/1 |
| South Africa (pace) | 181/37.04 | 6/2 | 221/33.34 | 5/1 | 402/35.00 | 11/3 |
| Australia (spin) | 97/31.18 | 5/2 | 87/26.13 | 2/0 | 184/29.79 | 7/2 |
| South Africa (spin) | 40/48.92 | 0/0 | 44/41.00 | 1/0 | 84/44.77 | 1/0 |
Australia's dominance near total
Since South Africa's readmission, the two teams have played each other in 11 series with Australia hosting five and South Africa six. Australia have by far been the better team winning seven of the 11 series, drawing three and losing just one (in 2008-09). In the 1990s, the teams were more evenly matched with Australia managing two series wins to go with series draws home and away (in 1994). Australia's dominance started with their away series win in 1997 (2-1) when they won the first two Tests by an innings and two wickets respectively. Six of the next seven series (2001-2011) have proved to be decisive with the only draw coming in the last series played in 2011. Australia won four successive series between 2001 and 2006 by margins of 3-0, 2-1, 2-0 and 3-1 before their run was brought to a halt in the 2008-09 series in Australia. The average difference (difference between batting and bowling averages) is a clear reflector of the grip Australia have had. Australia have an overall average difference of 6.86 (7.80 in home Tests and 6.10 in away Tests). The lower average differences for Australia (home 5.89 and away 4.70) in the 1990s point to closer contests in the decade. However, since 2000, when Australia lead the head-to-head tally 14-5, the corresponding numbers (9.00 and 6.81) are far higher.
| No of series | Series wins | Series losses | Series draws | Bat avg (Aus/SA) | Avg diff (Aus) | |
| Overall | 11 | 7 | 1 | 3 | 36.92/30.06 | 6.86 |
| In Australia | 5 | 3 | 1 | 1 | 39.38/31.58 | 7.80 |
| In South Africa | 6 | 4 | 0 | 2 | 34.87/28.77 | 6.10 |
| In 1990s (Australia) | 2 | 1 | 0 | 1 | 33.35/27.46 | 5.89 |
| In 1990s (South Africa) | 2 | 1 | 0 | 1 | 33.14/28.44 | 4.70 |
| Since 2000 (Australia) | 3 | 2 | 1 | 0 | 43.15/34.15 | 9.00 |
| Since 2000 (South Africa) | 4 | 3 | 0 | 1 | 35.75/28.94 | 6.81 |
Australia, who hold a 19-8 advantage in Tests played since South Africa's readmission, have an even distribution of wins batting first (nine) and second (ten). South Africa's story, however, is vastly different. They have won six Tests batting first but just two when they have had to bowl first. When these stats are analysed deeper, they reveal some interesting results. Australia have lost twice at home batting first with both the defeats coming in the 2008-09 series. They have an even win-loss record (4-4) when they have batted first in South Africa. South Africa, on the other hand, have won a Test each in Australia and South Africa batting first. However, they have suffered seven of their ten defeats (batting first) in home Tests. Australia have achieved wins by a margin of 150 or more runs on five occasions (three at home and two away) and triumphed by an innings three times including the second-biggest win in terms of runs (innings and 360-runs) in Johannesburg in 2002. South Africa beat Australia by an innings for the first time in the home series in 2009 after the visitors had taken an unassailable 2-0 lead in the three-Test series. Perhaps the most interesting aspect of Australia-South Africa matches has been the high number of 250-plus chases. Australia have done so five times overall (four in away Tests) and chased 300-plus targets on two occasions in Cape Town (2002) and Johannesburg (2011). South Africa, who successfully chased 335 in the third Test in Durban in 2002, won the first Test of the 2008-09 series in Perth by chasing a record 414.
| Team | Wins/losses (bat first) | Wins (by innings) | Wins (150 or more runs) | Wins (8 or more wickets) | Successful chases (250-plus) |
| Australia (overall) | 9/6 | 3 | 5 | 4 | 5 |
| South Africa (overall) | 2/10 | 1 | 1 | 3 | 2 |
| Australia (in Australia) | 5/2 | 1 | 3 | 3 | 1 |
| South Africa (in Australia) | 1/3 | 0 | 0 | 1 | 1 |
| Australia (in South Africa) | 4/4 | 2 | 2 | 1 | 4 |
| South Africa (in South Africa) | 1/7 | 1 | 1 | 2 | 1 |
Middle-order batting boosts Australia
Ponting, one of only three batsmen to score over 2000 runs against South Africa, has eight centuries in 23 Tests against them. He and Matthew Hayden aggregated over 1000 runs at 87.38 with four century stands in matches against South Africa. The Hayden-Justin Langer pair has also been among the most successful with 1030 runs at 57.22 (three century stands). For South Africa, the AB de Villiers-Jacques Kallis pair has been the most prolific averaging 95.71 with four century stands. Australia have comfortably outperformed South Africa in terms of the first and second-wicket partnership stats and extend the dominance to the middle-order stands too. For the third and fourth wickets, Australia average 39.75 and 44.69 while the corresponding numbers for South Africa are 35.34 and 41.10 respectively. The average third-wicket stand for both teams in Australia has not been high with South Africa in particular struggling (average of 26.14). South Africa's woes against Warne are reflected in the middle/lower-order partnership stats. While Australia average 43.71 and 35.94 for the fifth and sixth wickets, South Africa have failed to stitch together too many useful partnerships and have corresponding averages of just 28.48 and 22.61. On more than one occasion, Australia have wriggled out of a hole with the help of some gritty lower-order stands. Against South Africa in the 2005 Boxing Day Test, Michael Hussey and Glenn McGrath added a crucial 107 for the last wicket to rescue Australia from a score of 248/9 and paved the way for Australia's 184-run win. Twice in Johannesburg (2006 and 2011), Australia's lower-order shared vital partnerships and enabled the visitors to chase down targets of 292 and 310.
| Wicket | Aus (in Aus) | SA (in Aus) | Aus (in SA) | SA (in SA) | Aus (overall) | SA (overall) |
| 1 | 44.07, 2/7 | 37.51, 3/3 | 38.50, 3/6 | 40.12, 2/8 | 41.05, 5/13 | 38.88, 5/11 |
| 2 | 51.96, 5/6 | 49.07, 3/10 | 53.38, 4/10 | 35.75, 2/5 | 52.73, 9/16 | 41.96, 5/15 |
| 3 | 35.28, 2/2 | 26.14. 0/6 | 43.35, 5/5 | 43.93, 5/4 | 39.75, 7/7 | 35.34, 5/10 |
| 4 | 58.04, 5/7 | 50.85, 6/4 | 33.56, 2/5 | 32.33, 1/6 | 44.69, 7/12 | 41.10, 7/10 |
| 5 | 50.87, 4/6 | 26.23, 2/3 | 37.57, 2/4 | 30.43, 2/3 | 43.71, 6/10 | 28.48, 4/6 |
| 6 | 26.33, 0/5 | 24.72, 1/3 | 44.48, 3/4 | 20.79, 0/4 | 35.94, 3/9 | 22.61, 1/7 |
| 7 | 31.52, 1/5 | 27.13, 1/1 | 33.88, 2/3 | 26.06, 2/4 | 32.77, 3/8 | 26.53, 3/5 |
| 8-10 | 27.86, 1/7 | 21.96, 1/7 | 16.36, 1/3 | 18.21, 0/8 | 21.43, 2/10 | 19.83, 1/10 |
Surprisingly, this is the first time that Australia and South Africa will face off in a Test in Brisbane. The teams have played five Tests each in Melbourne and Sydney with Australia holding a 2-1 and 4-1 record at the venues. Along with Sydney, Johannesburg and Cape Town have been venues that have yielded results in every match. Adelaide, the venue for the second Test, has witnessed the highest batting average in the first innings (52.77) in Australia-South Africa matches. However, as has usually been the case with the venue, the average in the subsequent three innings drops remarkably. In the previous Test between the two teams in Cape Town, South Africa and Australia were bowled out for 96 and 47 before the hosts comfortably chased down the 235-run target. While the average in the first innings at the venue is just 25.96, the fourth-innings average is a high 63.08. Batting has also eased up in the final innings in Durban Tests (average 41.95) as compared to the first three innings. The first, second and fourth innings in Melbourne and Sydney have been more or less similar. However, while the third-innings average drops to 26.06 in Melbourne, it is a much higher 48.73 at the SCG. Pace bowlers have dominated the wickets tally at all venues picking up more than 100 wickets in Johannesburg, Melbourne and Cape Town. Spinners have played a major role in Sydney, where they have picked up nearly 40% of the wickets (bowler wickets only).
| Venue | Matches | Result % | 1st inns (avg) | 2nd inns (avg) | 3rd inns (avg) | 4th inns (avg) | Pace (wickets/avg) | Spin (wickets/avg) |
| Johannesburg | 6 | 100 | 39.29 | 31.94 | 25.71 | 31.97 | 155/31.67 | 49/31.75 |
| Melbourne | 5 | 60 | 35.68 | 39.55 | 26.06 | 34.05 | 100/34.00 | 32/42.37 |
| Cape Town | 5 | 100 | 25.96 | 37.44 | 31.37 | 63.08 | 119/31.99 | 36/32.38 |
| Sydney | 5 | 100 | 38.89 | 31.69 | 48.73 | 32.95 | 92/34.39 | 61/32.16 |
| Durban | 4 | 75 | 32.62 | 25.48 | 28.21 | 41.95 | 90/35.97 | 32/28.84 |
| Adelaide | 3 | 66.66 | 52.77 | 33.23 | 32.94 | 17.92 | 67/34.52 | 32/33.06 |
Madhusudhan Ramakrishnan is a sub-editor (stats) at ESPNcricinfo
Read in App
Elevate your reading experience on ESPNcricinfo App.