Spin-shy New Zealand and Gayle's ton of Tests
New Zealand's Test series against West Indies will be a huge test for their spinners, and of the ability of their batsmen to play spin
Coming off a couple of torrid tours against India and New Zealand where they suffered three innings-defeats and never came anywhere near winning a single game, West Indies will now be looking to use their home advantage to set things right under Denesh Ramdin, their newly-anointed captain. For inspiration, they needn't look beyond New Zealand's previous tour to the Caribbean, when the visitors were beaten 2-0.
West Indies and New Zealand have played each other in only 12 Tests since the turn of the century, and five of these games have come after January 2012. By the end of this series, these teams would have played each other eight times in less than two years - a marked change considering they met only seven times in the 12 years before that. In the 12 games in the 21st century, New Zealand have had the upper hand, winning five and losing only two, while drawing the remaining five. However, in the 42 Tests the two teams have played against each other, West Indies have the edge with 12 wins against New Zealand's 11. The contest has been fairly even in recent times, with both New Zealand and West Indies having won a couple of games each on their respective home turfs since January 2012.
| Span | Matches | NZ Wins | WI Wins | Draws |
| Overall | 42 | 11 | 12 | 19 |
| Since Jan 2001 | 12 | 5 | 2 | 5 |
| Since Jan 2012 | 5 | 2 | 2 | 1 |
The recent Test records of both teams have been dismal, with both having lost more than they have won since January 2012. West Indies have won a couple of games each against Bangladesh, Zimbabwe and New Zealand in this period and have eight losses against the higher-ranked nations. New Zealand have had fewer wins than West Indies in this period despite having played more games. However, New Zealand's victories include an away win against Sri Lanka (in Colombo), something that even South Africa have not been able to do since 2000. They also had a 1-0 series victory against India and a closely fought 1-0 series loss to South Africa, both at home.
| Team | Matches | Won | Lost | Draw |
| West Indies | 17 | 6 | 8 | 3 |
| New Zealand | 24 | 5 | 10 | 9 |
One department in which West Indies have suffered the most is pace. Till 2000, the West Indian pacers averaged 26.61, but since then it's dropped to 37.03. This changing trend is also a reflection of the local pitches. Till 2000, spinners averaged 44.64 at the Sabina Park, the venue of the first Test in this series. The number has since improved to 28.16.
All through the 20th century, the West Indies were known for their pace bowling, to the extent that West Indies played 10 matches during that period where not a single over was bowled by a spinner. In that era, their fast bowlers took more than three times the number of wickets their spinners took; since January 2012, pace has accounted for only 15 more wickets than spin. The tables below brings out this difference.
| Bowling type | Players | Mat | Wkts | Ave | Econ | SR | 5 | 10 |
| Pace | 105 | 366 | 4016 | 26.55 | 2.69 | 59.10 | 161 | 19 |
| Spin | 82 | 356 | 1228 | 37.29 | 2.27 | 98.10 | 54 | 6 |
| Bowling type | Players | Mat | Wkts | Ave | Econ | SR | 5 | 10 |
| Pace | 9 | 17 | 135 | 34.62 | 3.28 | 63.2 | 6 | 1 |
| Spin | 12 | 17 | 120 | 30.20 | 3.02 | 59.9 | 8 | 2 |
While West Indian spinners have become more proficient, New Zealand's spin battery for this series comprises of Kane Williamson, Ish Sodhi and Mark Craig, all of whom average more than 40 at the first-class level. The New Zealand spinners took only five wickets, compared to 54 for the seamers, during the home series against West Indies in December 2013.
Also interesting is that opposition spinners have averaged 29.75 against New Zealand's batsmen since January 2012. Zimbabwe are the only team against whom spinners have done better in this period. In conditions likely to favour spinners, New Zealand's spin bowling and their batting against spin will both be put to the test during this tour.
Among the individuals players, West Indies' Shane Shillingford has made a significant impact at the world stage. Among bowlers who have taken 50-plus wickets since January 2012, Shillingford is the only one who has played fewer than 10 games. He has taken two ten-wicket hauls in this period, with only Saeed Ajmal and Rangana Herath having taken more.
| Player | Mat | Inns | Mdns | Wkts | Ave | Econ | SR | 5 | 10 |
| TA Boult | 21 | 38 | 167 | 78 | 26.93 | 2.92 | 55.30 | 3 | 1 |
| TG Southee | 16 | 30 | 125 | 72 | 23.97 | 2.90 | 49.50 | 3 | 1 |
| S Shillingford | 9 | 15 | 89 | 51 | 25.60 | 2.89 | 53.00 | 6 | 2 |
| N Wagner | 14 | 26 | 98 | 50 | 35.00 | 3.48 | 60.30 | 1 | 0 |
| KAJ Roach | 9 | 18 | 59 | 42 | 22.69 | 3.18 | 42.70 | 3 | 1 |
| DAJ Bracewell | 15 | 27 | 66 | 34 | 44.26 | 3.50 | 75.80 | 0 | 0 |
| TL Best | 11 | 18 | 32 | 29 | 32.00 | 3.64 | 52.70 | 2 | 0 |
| DJG Sammy | 17 | 28 | 84 | 25 | 49.36 | 3.03 | 97.70 | 0 | 0 |
| CS Martin | 7 | 12 | 40 | 23 | 27.86 | 3.32 | 50.30 | 1 | 0 |
| SP Narine | 6 | 11 | 60 | 21 | 40.52 | 3.09 | 78.50 | 2 | 0 |
Among the batsmen, only one West Indian - Shivnarine Chanderpaul - features in the list of top 20 run-getters in Tests since January 2012. The list does have a few New Zealanders though - Brendon McCullum, Ross Taylor and Kane Williamson - which is partly down to the fact that New Zealand have played a fairly high number of Tests during this period. Only Australia and England have played more matches than New Zealand's 24 in this period.
| Player | Mat | Inns | Runs | Ave | SR | 100 | 50 |
| BB McCullum | 24 | 42 | 1742 | 43.55 | 58.67 | 3 | 9 |
| LRPL Taylor | 21 | 37 | 1729 | 59.62 | 55.93 | 6 | 6 |
| S Chanderpaul | 16 | 27 | 1510 | 79.47 | 48.44 | 5 | 6 |
| KS Williamson | 23 | 41 | 1476 | 37.84 | 41.97 | 4 | 9 |
| MN Samuels | 14 | 23 | 1159 | 52.68 | 53.23 | 3 | 7 |
| DM Bravo | 14 | 25 | 856 | 37.21 | 44.81 | 2 | 2 |
| KOA Powell | 16 | 30 | 847 | 29.20 | 52.28 | 3 | 0 |
| BJ Watling | 15 | 23 | 847 | 40.33 | 44.00 | 3 | 5 |
| D Ramdin | 14 | 22 | 753 | 44.29 | 52.73 | 3 | 3 |
| DJG Sammy | 17 | 27 | 697 | 27.88 | 70.54 | 1 | 4 |
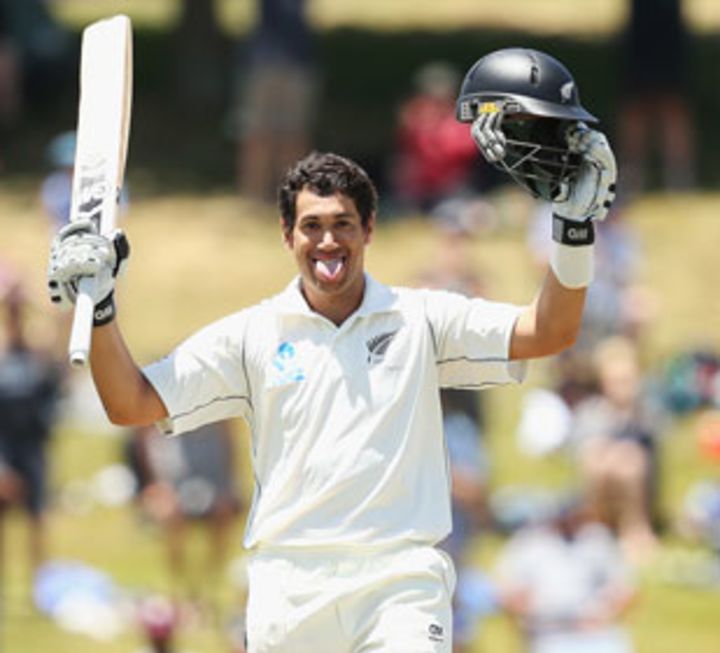
Chanderpaul's batting average of 79.47 is the highest for any batsmen during this period (minimum 200 runs). The top five players in the above table have had more than ten 50-plus scores. There have been 19 such players in the world since January 2012. In the recent series between these teams in New Zealand, Ross Taylor was in belligerent form scoring 495 runs in three matches at an average of 247.50, including three centuries. Keeping him quiet will be one of the priorities for West Indies.
Chris Gayle is on the verge of reaching a couple of milestones during this series. The next Test match that Gayle plays will be his 100th, and he is also only 67 runs shy of 7000 runs in Tests. On a quirkier note, if Gayle does not bowl in this match (and this seems likely considering his recent injuries) and scores exactly 81 runs, both his Test batting and bowling averages will become exactly 42. As of today, no Test player (past or present) has the exact same batting and bowling average.
Bishen Jeswant is a stats sub-editor at ESPNcricinfo. He tweets here.
Read in App
Elevate your reading experience on ESPNcricinfo App.