Incredible Smith, misfiring England
Australia's middle order was way superior to England's, while their four-man bowling attack took care of England's key batsmen to ensure a comprehensive series win
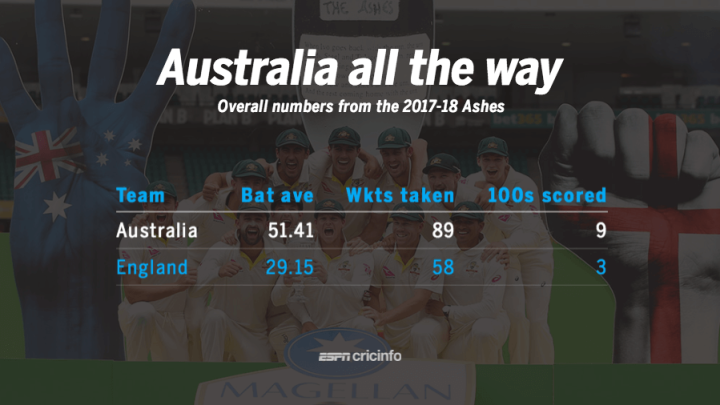
As beatdowns go, this 4-0 Ashes drubbing by Australia was a pretty comprehensive one. They averaged 51 with the bat to England's 29, took 89 wickets to England's 58, and scored nine hundreds to England's three. Their fast bowlers took 66 wickets at 28, to England's 47 at 43, while the spin comparison was the most lopsided of all: 21 wickets at 30.8 for Australia, and eight wickets at 112.5 for England. Game, set, match, and series to Australia. The ratio of batting to bowling averages for Australia was 1.76, which was fairly close to the ratios during their 5-0 drubbings in 2005-06 and 2013-14.
| Series | Scoreline | Bat ave | Bowl ave | Ratio |
| 2006-07 | 5-0 | 52.77 | 26.35 | 2.00 |
| 2013-14 | 5-0 | 41.41 | 21.58 | 1.92 |
| 2017-18 | 4-0 | 51.41 | 29.15 | 1.76 |
For England, the story of the series was that they were in the game for some periods - especially in the first three Tests - but not for long enough. The key stat that reflects this is the conversion rate of fifties to hundreds. England's batsmen made 13 fifties in the series but only three hundreds, compared to 11 fifties and nine hundreds for Australia. That, in a nutshell, was the difference between the two teams.
Top-order comparison
The gap was largely in the top orders of the two teams; despite all the talk of England's feeble tail, the difference between Nos. 8-11 of the two teams was negligible: Australia's tail averaged 16.12 to England's 15.64. However, Australia's top seven batsmen were streets ahead of England's, and the gap in averages - 63.38 to 33.85 - shows how large the difference was.
Thirty-six times in the series, England's top seven batsmen were dismissed between 14 and 60, which is only four short of their all-time record in an Ashes series. (There were 40 such dismissals in 1981, but that was a six-Test series; in five Tests, the record is 37, in 1920-21 and 1974-75.) Australia's top-order batsmen fell only 21 times in this score range. Compare this to the number of hundreds scored, and the difference between the two teams becomes clear. In terms of median scores of the top orders, Australia were only 32.5 to England's 20, but thanks to the conversion rate, the difference in averages was much greater.
| Team | Out between 14-60 | 100s |
| Australia | 21 | 9 |
| England | 36 | 3 |
Apart from Cameron Bancroft and Peter Handscomb, who was dropped after two Tests, each of Australia's top seven averaged more than 45, while Pat Cummins averaged an impressive 41.50 too; for England, only two batsmen - Joe Root and Alastair Cook - finished with 45-plus averages.
Only two runs separated the series aggregates of Root (378) and Cook (376), but the distribution of how they scored their runs couldn't have been more different. Cook scored 65% of his runs in one innings, and remained not-out in that innings too; in the other eight attempts, he averaged 16.5. Root passed 50 in five out of nine innings, but his highest score was only 83. The median scores for the two batsmen illustrates this difference, more than the averages - Root's median score was 51 - which means in four of his nine innings he scored more than 51 - while Cook's was 14.
The partnership details
England's batting woes started at the top of the order, with Cook and Mark Stoneman aggregating 193 in nine opening partnerships, and passing 50 only once. None of their top four wickets averaged more than 45, while the fifth-wicket average of 56.88 was largely due to the 237-run stand between Jonny Bairstow and Dawid Malan in Perth.
Despite Bancroft's relatively poor series, Australia's average opening stand was reasonably healthy - it helped that the pair added 173 unbroken runs in Brisbane - while they also had excellent averages for the third and fifth wickets. And thanks to the presence of Pat Cummins down the order, they also had three 50-plus stands for the eighth wicket.
| For wkt | Aus-runs | Ave | 100/50 | Eng-runs | Ave | 100/50 |
| 1 | 436 | 62.28 | 2/1 | 193 | 21.44 | 0/1 |
| 2 | 233 | 33.28 | 0/2 | 337 | 37.44 | 1/2 |
| 3 | 528 | 75.42 | 3/1 | 349 | 38.77 | 1/0 |
| 4 | 324 | 46.28 | 2/1 | 380 | 42.22 | 1/1 |
| 5 | 741 | 123.5 | 2/2 | 512 | 56.88 | 1/1 |
| 6 | 215 | 35.83 | 0/2 | 188 | 20.88 | 0/0 |
| 7 | 61 | 10.16 | 0/0 | 199 | 22.11 | 0/1 |
| 8 | 333 | 66.6 | 0/3 | 183 | 20.33 | 0/1 |
Australia's relentless bowling attack
Australia's bowlers took 87 wickets, and they were shared almost equally among their four frontline bowlers, with all of them picking up 20-plus wickets at sub-30 averages. For England, as many as nine bowlers picked up at least one wicket, but four of them - Tom Curran, Moeen Ali, Jake Ball and Mason Crane - conceded at least 100 runs per wicket. James Anderson was by far their best bowler in terms of picking up wickets and controlling the runs, but none of the others had a series to remember.
In fact, this is only the third instance of four bowlers from one team taking 20-plus wickets in a series; it happened previously in the 2005-06 Ashes, when Stuart Clark, Shane Warne, Glenn McGrath and Brett Lee starred in a 5-0 win, and by West Indies in the 1995 Wisden Trophy series in England. West Indies' effort, though, came in a six-Test series, which means this was only the second such instance in a five-match series.
The head-to-head battles
With Australia winning the series so comprehensively, they obviously dominated the player-v-player stats too. As a bowling unit, it seemed they had one bowler who had the number of at least one England top-order batsman. The Moeen Ali v Lyon battle was the one that was the most talked about, but there were other lopsided head-to-heads as well: Bairstow v Starc, Root v Cummins, Stoneman v Starc, and Vince v Hazlewood were the other cases of a batsman falling to a bowler at least four times at an average of 20 or less. Cook fell three times each to Hazlewood and Lyon, averaging in the mid-20s against each. Malan was the one England batsman averaging more than 25 against each of the four Australian bowlers.
| Batsman | Bowler | Runs | BF | Dis | Ave |
| MM Ali | NM Lyon | 90 | 218 | 7 | 12.85 |
| JM Bairstow | MA Starc | 60 | 119 | 4 | 15.00 |
| JE Root | PJ Cummins | 71 | 171 | 4 | 17.75 |
| MD Stoneman | MA Starc | 80 | 137 | 4 | 20.00 |
| JM Vince | JR Hazlewood | 41 | 115 | 4 | 10.25 |
| AN Cook | JR Hazlewood | 78 | 164 | 3 | 26.00 |
| AN Cook | NM Lyon | 73 | 196 | 3 | 24.33 |
| DJ Malan | NM Lyon | 116 | 297 | 3 | 38.66 |
Lyon's successes against Moeen, Cook and Malan was illustrative of his dominance against left-hand batsmen: he averaged 18.44 against them, and 93.66 against the right-handers. When bowling to Root, Vince and Bairstow, he returned combined figures of 2 for 224. However, while he didn't dismiss right-handers, he still kept it tight against them, going at only 2.46 runs per over.
| Batsman type | Runs | Balls | Wkts | Ave |
| Left-handers | 332 | 878 | 18 | 18.44 |
| Right-handers | 281 | 684 | 3 | 93.66 |
For England, the one standout bowler was Anderson. His domination of Usman Khawaja was similar to the stranglehold that Australia's bowlers had on England: in 31 overs to Khawaja, Anderson conceded only 34, while dismissing him three times. Anderson also had Handscomb's number before he was dropped, while Stuart Broad had a fair amount of success against Shaun Marsh and Bancroft.
| Batsman | Bowler | Runs | BF | Dis | Ave |
| UT Khawaja | JM Anderson | 34 | 186 | 3 | 11.33 |
| SE Marsh | SCJ Broad | 67 | 158 | 3 | 22.33 |
| CT Bancroft | SCJ Broad | 41 | 111 | 2 | 20.50 |
| CT Bancroft | CR Woakes | 47 | 108 | 2 | 23.50 |
| PSP Handscomb | JM Anderson | 15 | 42 | 2 | 7.50 |
Overall, there were seven instances of a batsman scoring 100-plus runs against a bowler in the series. Six of those were by Australian batsmen, and four by Steven Smith. That is another stat that, in a nutshell, captures Australia's total domination of England in the series.
| Batsman | Bowler | Runs | BF | Dis | Ave |
| SPD Smith | CR Woakes | 148 | 257 | 1 | 148.00 |
| SPD Smith | JM Anderson | 122 | 345 | 1 | 122.00 |
| SE Marsh | MM Ali | 121 | 249 | 1 | 121.00 |
| DJ Malan | NM Lyon | 116 | 297 | 3 | 38.66 |
| SPD Smith | MM Ali | 113 | 187 | 1 | 113.00 |
| SPD Smith | SCJ Broad | 110 | 272 | 0 | - |
| DA Warner | JM Anderson | 101 | 225 | 2 | 50.50 |
S Rajesh is stats editor of ESPNcricinfo. @rajeshstats
Read in App
Elevate your reading experience on ESPNcricinfo App.