The IPL in numbers
Most entertaining match-ups, most runs in boundaries, and other significant stats from the IPL
- A total of 96,722 runs have been scored in the IPL in the first five editions, at an average of 25.61 runs for every wicket. These runs have been scored at a rate of 7.89 runs an over. An average of 5.87 wickets has been taken in every innings at a strike rate of 19.49 balls per wicket.Loading ...
- The average 20-over score in the IPL has been 157.71. Quite predictably, the 2009 edition that was played in South Africa had the lowest average, of 149.60. The 2010 edition was the most batsman-friendly, with an average score of 166.
- A total of 3,086 sixes and 8,555 fours have been struck, with a four or a six every 6.32 balls, and a six every 24 balls. The opening edition was the hardest on the bowlers in terms of boundaries scored, with a four or a six every 5.57 balls and a six every 21 balls.
- Chennai Super Kings have scored the highest number of runs by a team in the tournament, 12,736, at an average of 30.18 runs per wicket - significantly higher than the tournament average of 25.61. Deccan Chargers have been the underperformers with the bat (among teams that have played all the seasons) with an average of 23.73 runs per wicket.
- Mumbai Indians have been the best bowling team in the IPL. Mumbai have taken the highest number of wickets by any team in the IPL - 485 at an average of 22.94 (best in the IPL). Mumbai also have been the most economical, conceding 7.34 runs an over.
- What won Chargers their only IPL trophy in 2009 was largely their bowling. Chargers took 110 wickets in that year, the most by any IPL team in a season, at an average of 21.70. The best bowling team in a season in terms of average, though, is Delhi Daredevils in 2009 - they took 106 wickets that year at an average of 20.35.
- IPL 2009 was the best edition for bowlers: they enjoyed the helpful conditions in South Africa, averaging 23.41 per wicket. This is significantly lower than the overall IPL average of 25.61. The bowlers had a strike rate of 18.77 in 2009, against the tournament average strike rate of 19.49.
- Matches between Super Kings and Royal Challengers Bangalore have been the ones to watch out for, in terms of runs and wickets. Twelve matches between the two teams have produced 3750 runs, the most runs involving any two teams, and 150 wickets, again the highest involving any pair of teams.
- Teams batting second have won 53.87% (174 out of 323) of matches in the IPL. Super Kings have the highest win percentage (65.52%, 19 wins out of 29) for teams batting second. The highest number of wins batting second, though, have been recorded by Daredevils and Royal Challengers - 26. Mumbai have the highest win percentage (56.41%, 22 wins out of 39) batting first, with Super Kings winning the most number of matches batting first - 28.
- Scoring rates have been the slowest in over numbers one and seven in the IPL. The first over has gone for 3,834 runs at 5.96 and the seventh for 4,174 runs at 6.51 runs an over. Teams have scored the fastest in the 20th, achieving a run-rate of 10.46. Splitting the 20 overs into three parts, the average rate in the Powerplay overs (one to six) is 7.42, between seven and 14 is 7.34, and between 15 and 20 it's 9.29. Daredevils score at 8.18 runs an over in the Powerplay overs, the highest for a team in the IPL, followed by Super Kings at 8.05 runs an over.
- The overall numbers for pace and spin are pretty similar. Fast bowlers have taken 67% of the wickets (2261 of 3363) to have fallen to bowlers, but they have also bowled an equivalent share (65%) of deliveries. Mumbai and Daredevils have relied heavily on their fast bowlers, with more than 75% of their wickets going to fast bowlers.
- The MA Chidambaram Stadium in Chennai has produced the most runs by any ground that has hosted more than 15 matches in the IPL - 9920 runs at an average of 26.31 (also the highest). Batsmen have found scoring runs tough at the DY Patil Stadium, Mumbai; they have scored 4490 runs from 17 matches at an average of 20.78. The DY Patil Stadium has been the best for spin bowlers too - they have taken 69 wickets at an average 21.76.
- Of a total of 323 IPL matches, there have been 15 instances of teams chasing down targets off the last ball of a match. There have been four instances of teams winning by a margin of one run, while two games have been tied - between Super Kings and Kings XI in 2010, and Kolkata Knight Riders and Rajasthan Royals in 2009.
- Royal Challengers have scored the highest percentage of runs in boundaries among all teams in the IPL - 59%. They've scored 6506 runs in boundaries (1004 fours and 415 sixes). However, Super Kings have scored the most sixes, 449, and fours, 1075, in the IPL.
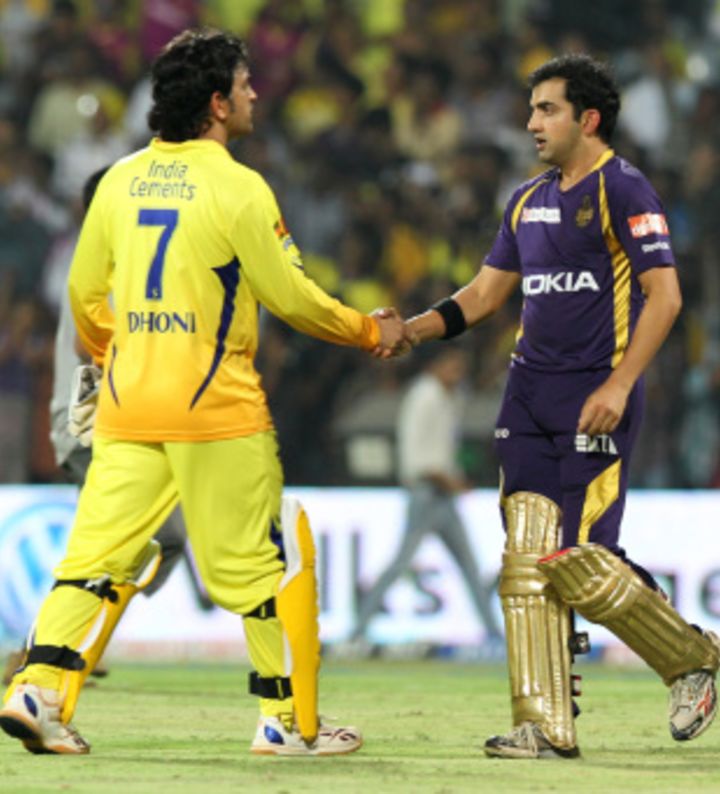
- Gautam Gambhir has the best win-loss ratio of 1.61 among captains who have led in at least 20 matches in the IPL. He is followed by MS Dhoni (1.48) and Sachin Tendulkar (1.42). Dhoni is the captain with most IPL wins - his 46 wins have come in 78 matches.
Shiva Jayaraman is sub-editor, stats, at ESPNcricinfo
Read in App
Elevate your reading experience on ESPNcricinfo App.