An unworthy end to Ponting's stellar career
Ricky Ponting scored 18 runs at 3.60 in his last five ODI innings. There aren't many who have done worse than that
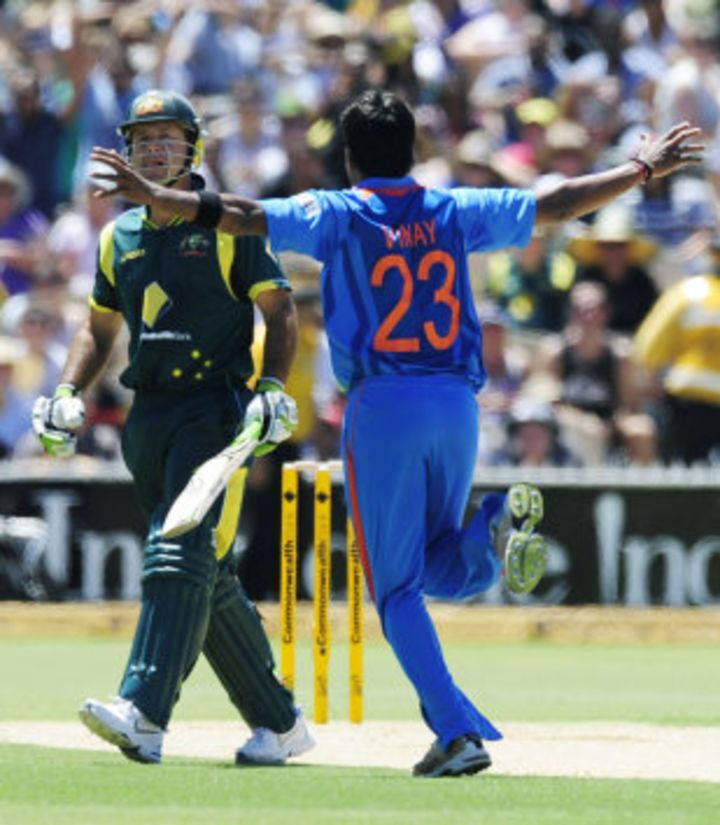
Ricky Ponting did not say he was retiring from one-day cricket but accepted that his limited-overs career for Australia was over after he was axed from the squad during the ongoing Commonwealth Bank Series. For someone who scored 13,704 ODI runs and won every trophy worth winning, Ponting went quietly. Five failures in the triangular tournament had forced the selectors' decision. Ponting did not complain, and those who did weren't too loud either.
This week's column is about batsmen who averaged the least in the final few innings of their careers. Ponting scored 18 runs at 3.60 in his last five ODI innings. There aren't many who have done worse than that.
Ponting's ODI slump came soon after he made 221 and 60 not out in the fourth Test against India, in Adelaide. He has expressed his intention to continue playing Tests, but in the unlikely event he doesn't get picked again, he will have one of the highest run aggregates in a final Test.
Ponting also happened to be captain in his final ODI, as a stand-in for the injured Michael Clarke. The only other notable captain in our table to have an extremely poor run in his final few innings was New Zealand's Geoff Howarth. His last ODIs were against Pakistan at home, in the World Championship of Cricket in Australia, and on the tour of West Indies. Howarth scored 81 runs at an average of 9 in his last ten innings.
Tony Greig played only 22 ODIs and made 63 runs at an average of 6.30 in his last ten innings. His best score during that phase was 22 against Australia at Old Trafford. Greig's aggregate is the lowest for any batsman in his final ten one-day innings.
Mohammad Ashraful was dropped from Bangladesh's last ODI series, against Pakistan in December 2011, after a string of failures in the format. Ashraful's 262 runs at 13.10 get him a place in the table of batsmen with the lowest averages in their final 20 innings. His aggregate of 70 at an average of 7 in his last ten ODIs puts him third in that table, after Greig and former Bangladesh batsman Al Shahriar. It's likely that Ashraful will play for Bangladesh again, though, so he could take himself off this list with one good performance.
| Player | Span | Career | Inns | Runs | HS | Ave | 100 | Runs | Ave | List |
|---|---|---|---|---|
| LJ Burger (Nam) | 2003-2003 | 6 | 6 | 11 | 5 | 2.20 | 0 | 7 | 1.40 | 0, 5, 0, 1, 1 |
| S Matsikenyeri (Zim) | 2002-2012 | 112 | 109 | 2205 | 90 | 22.05 | 0 | 10 | 2.00 | 0, 1, 1, 3, 5 |
| TR Ambrose (Eng) | 2008-2008 | 5 | 5 | 10 | 6 | 2.50 | 0 | 10 | 2.50 | 1*, 1, 0, 6, 2 |
| TM Dowlin (WI) | 2009-2010 | 11 | 11 | 228 | 100* | 25.33 | 1 | 11 | 2.75 | 1, 2, 0*, 8, 0 |
| TE Blain (NZ) | 1986-1994 | 38 | 38 | 442 | 49* | 16.37 | 0 | 14 | 2.80 | 4, 5, 2, 3, 0 |
| JWM Dalrymple (Eng) | 2006-2007 | 27 | 26 | 487 | 67 | 19.48 | 0 | 14 | 2.80 | 3, 5, 3, 2, 1 |
| MW Gatting (Eng) | 1977-1993 | 92 | 88 | 2095 | 115* | 29.50 | 1 | 16 | 3.20 | 0, 7, 6, 1, 2 |
| B Zuiderent (Neth) | 1996-2011 | 57 | 56 | 1097 | 77* | 23.84 | 0 | 17 | 3.40 | 0, 1, 1, 15, 0 |
| RT Ponting (Aus/ICC) | 1995-2012 | 375 | 365 | 13704 | 164 | 42.03 | 30 | 18 | 3.60 | 2, 1, 6, 2, 7 |
| MJ Smith (Scot) | 1999-1999 | 5 | 5 | 19 | 13 | 3.80 | 0 | 19 | 3.80 | 13, 3, 1, 1, 1 |
| SB Bangar (India) | 2002-2004 | 15 | 15 | 180 | 57* | 13.84 | 0 | 20 | 4.00 | 1, 7, 9, 3, 0 |
| MA Ouma (Kenya) | 2004-2011 | 72 | 69 | 1291 | 61 | 19.86 | 0 | 22 | 4.40 | 1, 16, 1, 0, 4 |
| AL Logie (WI) | 1981-1993 | 158 | 133 | 2809 | 109* | 28.95 | 1 | 18 | 4.50 | 7, 1, 1*, 8, 1 |
| J Arun Lal (India) | 1982-1989 | 13 | 13 | 122 | 51 | 9.38 | 0 | 23 | 4.60 | 16, 0, 0, 1, 6 |
| JJ Celestine (Ber) | 2007-2008 | 8 | 8 | 60 | 20 | 7.50 | 0 | 23 | 4.60 | 1, 2, 12, 8, 0 |
| ED Solkar (India) | 1974-1976 | 7 | 6 | 27 | 13 | 4.50 | 0 | 24 | 4.80 | 0, 8, 13, 1, 2 |
| UC Hathurusingha (SL) | 1992-1999 | 35 | 33 | 669 | 66 | 20.90 | 0 | 24 | 4.80 | 3, 0, 14, 7, 0 |
| HP Rinke (Zim) | 2006-2006 | 18 | 18 | 317 | 72 | 17.61 | 0 | 25 | 5.00 | 10, 10, 3, 1, 1 |
| Mohammad Ashraful (Asia/Ban) | 2001-2011 | 171 | 164 | 3397 | 109 | 22.49 | 3 | 25 | 5.00 | 2, 6, 15, 2, 0 |
| DC Thomas (WI) | 2009-2011 | 9 | 7 | 70 | 29* | 11.66 | 0 | 26 | 5.20 | 13, 2, 9, 2, 0 |
Ian Healy's ODI career ended in 1997 after he scored only 211 runs with a high score of 27 and an average of 13.18 in his final 20 innings. Adam Gilchrist replaced him. Healy kept Gilchrist out of Australia's Test team for longer, though, by the quality of his wicketkeeping, until his form tapered off in 1999. Healy managed only 170 runs in his last 20 Test innings, at an average of 8.94. It is the second-lowest average for any batsman in his final 20 Test innings.
Michael Bevan was a champion in one-day cricket. Not so in Tests. He played only 18 matches and was dropped after scoring 90 runs at 9.00 in his last ten innings. Bevan had scored three consecutive half-centuries against West Indies in 1996-97 but his form tapered off after that and he was dropped following poor tours of South Africa and England in the summer of 1997. Bevan was recalled for the SCG Test against South Africa in January 1998 in place of Michael Kasprowicz, but another failure ended his Test career for good.
Kim Hughes had an awful end to his career. He quit the captaincy in tears after Australia lost to West Indies at the Gabba in November 1984*, and then played only two more Tests as a batsman. Hughes made only six runs in his last five innings, and his average of 1.60 is the lowest in our table below.
There are a couple of current players whose recent performances have been so poor that the averages of their last five innings rank among the 20 lowest. India's Suresh Raina scored 1, 4, 10, 0 and 0 in his last five innings, which were on the tour of England. He was dropped for the home Tests against West Indies and the tour of Australia. Averaging 3.00 in his last five innings, Raina will have to wait until the space opens up in India's middle order for another go.
Australia's Shaun Marsh could also find himself out of the Test squad after scores of 0, 3, 0, 11, 3, 0 during the four-Test series against India. Marsh averaged 3.40 in his last five innings and needs strong Sheffield Shield performances to ensure he gets on the plane to the Caribbean in March.
| Player | Span | Career | Inns | Runs | HS | Ave | 100 | Runs | Ave | List | ||
|---|---|---|---|---|---|---|---|---|---|---|---|---|
| KJ Hughes (Aus) | 1977-1984 | 70 | 124 | 4415 | 213 | 37.41 | 9 | 6 | 1.20 | 4, 0, 2, 0, 0 | ||
| MK Mantri (India) | 1951-1955 | 4 | 8 | 67 | 39 | 9.57 | 0 | 8 | 1.60 | 0, 1, 5, 0, 2 | ||
| JR Murray (WI) | 1993-2002 | 33 | 45 | 918 | 101* | 22.39 | 1 | 8 | 1.60 | 0, 7, 0, 0, 1 | ||
| NS Harford (NZ) | 1955-1958 | 8 | 15 | 229 | 93 | 15.26 | 0 | 9 | 1.80 | 3, 0, 0, 2, 4 | ||
| GA Lohmann (Eng) | 1886-1896 | 18 | 26 | 213 | 62* | 8.87 | 0 | 11 | 2.20 | 0, 0, 2, 8, 1 | ||
| AJW McIntyre (Eng) | 1950-1955 | 3 | 6 | 19 | 7 | 3.16 | 0 | 15 | 3.00 | 0, 1, 7, 3, 4 | ||
| CJ Richards (Eng) | 1986-1988 | 8 | 13 | 285 | 133 | 21.92 | 1 | 15 | 3.00 | 2, 2, 8, 0, 3 | ||
| SK Raina (India) | 2010-2011 | 15 | 26 | 710 | 120 | 29.58 | 1 | 15 | 3.00 | 1, 4, 10, 0, 0 | ||
| RW Morgan (NZ) | 1965-1972 | 20 | 34 | 734 | 97 | 22.24 | 0 | 16 | 3.20 | 0, 8, 2, 4, 2 | ||
| AG Kripal Singh (India) | 1955-1964 | 14 | 20 | 422 | 100* | 28.13 | 1 | 13 | 3.25 | 2*, 10, 0, 0, 1 | ||
| F Mitchell (Eng/SA) | 1899-1912 | 5 | 10 | 116 | 41 | 11.60 | 0 | 17 | 3.40 | 0, 1, 1, 12, 3 | ||
| EG Hayes (Eng) | 1906-1912 | 5 | 9 | 86 | 35 | 10.75 | 0 | 17 | 3.40 | 0, 0, 4, 9, 4 | ||
| KBJ Azad (India) | 1981-1983 | 7 | 12 | 135 | 24 | 11.25 | 0 | 17 | 3.40 | 0, 5, 9, 0, 3 | ||
| D Williams (WI) | 1992-1998 | 11 | 19 | 242 | 65 | 13.44 | 0 | 17 | 3.40 | 0, 0, 0, 15, 2 | ||
| PA Wallace (WI) | 1997-1999 | 7 | 13 | 279 | 92 | 21.46 | 0 | 17 | 3.40 | 1, 8, 0, 4, 4 | ||
| SE Marsh (Aus) | 2011-2012 | 7 | 11 | 301 | 141 | 27.36 | 1 | 17 | 3.40 | 3, 0, 11, 3, 0 | ||
| GJ Bonnor (Aus) | 1880-1888 | 17 | 30 | 512 | 128 | 17.06 | 1 | 18 | 3.60 | 8, 0, 5, 5, 0 | ||
| EFS Tylecote (Eng) | 1882-1886 | 6 | 9 | 152 | 66 | 19.00 | 0 | 15 | 3.75 | 0, 5, 0, 0, 10* | ||
| AN Hornby (Eng) | 1879-1884 | 3 | 6 | 21 | 9 | 3.50 | 0 | 19 | 3.80 | 4, 2, 9, 0, 4 | ||
| JW Guy (NZ) | 1955-1961 | 12 | 23 | 440 | 102 | 20.95 | 1 | 19 | 3.80 | 1, 8, 1, 9, 0 |
* 10:10 GMT Feb 22: This article originally stated that Kim Hughes ended his career in 1986. This has been corrected
Travis Basevi is a cricket statistician and UK Senior Programmer for ESPNcricinfo and other ESPN sports websites. George Binoy is an Assistant Editor at ESPNcricinfo
Read in App
Elevate your reading experience on ESPNcricinfo App.