Misers and spendthrifts in the same team
The largest differences between the economy rates of two bowlers in an innings
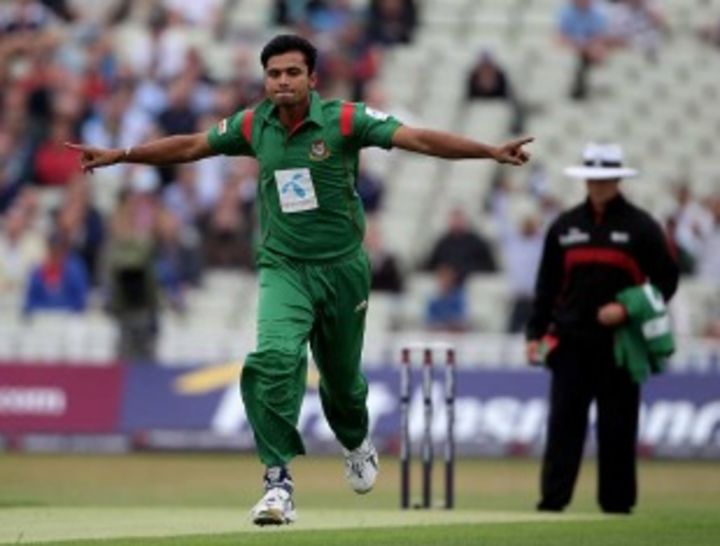
Two Bangladesh bowlers had a remarkable difference in their economy rates during the third ODI against England at Edgbaston, where the visitors suffered a 144-run defeat to lose the series 2-1. While Mashrafe Mortaza struck in the first over and eventually finished with 3 for 31 off 10, his new-ball partner Shafiul Islam conceded 11 in his first over, and 97 in nine, as England amassed 347. The difference of 7.67 in their economy rates is the fourth-highest between those of two bowlers in a one-dayer.
The largest difference between the economy rates of two team-mates in an ODI is nearly nine runs - Nathan Bracken went for 3.44 an over and Stuart Clark bled 12.42 against West Indies in Kuala Lumpur in 2006. The West Indians - Chris Gayle and Brian Lara in particular - targeted Clark, taking him for 87 in seven overs, while allowing the others reasonable economies. Offspinner Dan Cullen's 5.66 was the second worst. That match was Michael Hussey's first as captain and West Indies won by three wickets. Since then Hussey's led in three more ODIs and Australia have lost all of them, making him Australia's only winless ODI captain (not including David Hookes and Ray Bright, both of whom led in only one match).
How many times do you think Glenn McGrath was the most expensive bowler for Australia in an ODI, considering he had a career economy rate of 3.88 in 250 matches? There's no easy way to tell, but the Sydney ODI against Pakistan in 2000, when McGrath was outbowled by a debutant, was possibly his worst performance. Australia were defending 286 and McGrath had conceded 29 in his first two overs, before getting hit for five consecutive boundaries by Abdul Razzaq in his fifth. Pakistan reached 100 in the 13th over before the debutant Stuart MacGill struck with his sixth delivery. The legspinner finished with 4 for 19, the second-best figures on debut for Australia, and was Man of the Match as well, while McGrath ended with 1 for 67 in eight overs. There was a difference of 6.47 between their economy rates.
| Player | Econ | Figures | Player | Econ | Figures | Diff | Team | Oppn. | Date | Scorecard |
|---|---|---|---|---|
| NW Bracken | 3.44 | 1/31 (9.0) | SR Clark | 12.42 | 0/87 (7.0) | 8.98 | Aus | v WI | 18 Sep 2006 | ODI 2417 |
| SJ Harmison | 3.10 | 3/31 (10.0) | SI Mahmood | 11.42 | 2/80 (7.0) | 8.32 | Eng | v SL | 20 Jun 2006 | ODI 2385 |
| Harbhajan Singh | 1.40 | 2/14 (10.0) | L Balaji | 9.62 | 0/77 (8.0) | 8.22 | India | v Eng | 3 Sep 2004 | ODI 2165 |
| Mashrafe Mortaza | 3.10 | 3/31 (10.0) | Shafiul Islam | 10.77 | 2/97 (9.0) | 7.67 | Ban | v Eng | 12 Jul 2010 | ODI 3026 |
| SR Tendulkar | 2.80 | 1/28 (10.0) | BKV Prasad | 10.42 | 0/73 (7.0) | 7.62 | India | v SL | 29 Oct 2000 | ODI 1652 |
| Shahid Afridi | 4.20 | 2/42 (10.0) | Naved-ul-Hasan | 11.50 | 2/92 (8.0) | 7.30 | Pak | v SA | 4 Feb 2007 | ODI 2506 |
| Mohammad Rafique | 5.40 | 0/54 (10.0) | Tapash Baisya | 12.42 | 0/87 (7.0) | 7.02 | Ban | v Eng | 21 Jun 2005 | ODI 2252 |
| AY Karim | 0.84 | 3/7 (8.2) | CO Obuya | 7.75 | 0/62 (8.0) | 6.91 | Kenya | v Aus | 15 Mar 2003 | ODI 1990 |
| Mohammad Rafique | 1.40 | 0/14 (10.0) | Mashrafe Mortaza | 8.28 | 1/58 (7.0) | 6.88 | Ban | v Aus | 23 Apr 2006 | ODI 2365 |
| MA Suji | 2.60 | 1/26 (10.0) | JO Angara | 9.42 | 0/66 (7.0) | 6.82 | Kenya | v India | 23 May 1999 | ODI 1457 |
| Habibul Bashar | 3.10 | 1/31 (10.0) | Khaled Mahmud | 9.75 | 1/78 (8.0) | 6.65 | Ban | v WI | 9 Oct 1999 | ODI 1511 |
| SK Warne | 2.10 | 2/21 (10.0) | B Lee | 8.75 | 0/70 (8.0) | 6.65 | Aus | v Zim | 21 Jan 2001 | ODI 1674 |
| RJ Hadlee | 2.16 | 1/26 (12.0) | MC Snedden | 8.75 | 2/105 (12.0) | 6.58 | NZ | v Eng | 9 Jun 1983 | ODI 197 |
| SCG MacGill | 1.90 | 4/19 (10.0) | GD McGrath | 8.37 | 1/67 (8.0) | 6.47 | Aus | v Pak | 19 Jan 2000 | ODI 1542 |
| SM Pollock | 2.50 | 1/20 (8.0) | PL Symcox | 8.93 | 0/64 (7.1) | 6.43 | SA | v NZ | 20 Feb 1999 | ODI 1409 |
| MA Suji | 1.70 | 1/17 (10.0) | MO Odumbe | 8.11 | 1/73 (9.0) | 6.41 | Kenya | v Zim | 11 Dec 2002 | ODI 1915 |
| Maninder Singh | 3.00 | 2/30 (10.0) | RMH Binny | 9.37 | 2/75 (8.0) | 6.37 | India | v Aus | 2 Oct 1986 | ODI 393 |
| CO Obuya | 5.20 | 0/52 (10.0) | MA Suji | 11.57 | 0/81 (7.0) | 6.37 | Kenya | v India | 24 Oct 2001 | ODI 1764 |
| GD McGrath | 2.23 | 2/22 (9.5) | B Lee | 8.50 | 1/85 (10.0) | 6.26 | Aus | v Pak | 9 Jun 2001 | ODI 1720 |
| JDP Oram | 4.25 | 0/34 (8.0) | TG Southee | 10.50 | 0/105 (10.0) | 6.25 | NZ | v India | 8 Mar 2009 | ODI 2823 |
There are a couple of entries in the table above that are unusual. The first is that of Kenya's Aasif Karim taking 3 for 7 in 8.2 overs, with an economy rate of 0.84, against Australia in the 2003 World Cup. The Australians compensated for their inability to score against Karim by taking the Suji brothers, Martin and Tony, for 12 an over and Collins Obuya for 7.75.
The second unusual one is the West Indies-England ODI in the 2007 World Cup - Brian Lara's last international and Michael Vaughan's last ODI. It was only the third time Vaughan bowled a full spell in an ODI and he took 3 for 39. Vaughan was needed largely because Liam Plunkett went for 71 in seven overs. The difference between the economy rates of Vaughan and Plunkett was 6.24.
The largest difference between economy rates in a Twenty20 international - 11.83 - was in the 2010 World Twenty20 match between West Indies and England in Guyana. Ravi Rampaul came under attack from Eoin Morgan and Luke Wright and went for 52 in three overs. Darren Sammy, on the other hand, proved harder to hit and England scored at only 5.50 per over off him.
| Player | Econ | Figures | Player | Econ | Figures | Diff | Team | Oppn | Date | Scorecard |
|---|---|---|---|---|
| DJG Sammy | 5.50 | 2/22 (4.0) | R Rampaul | 17.33 | 0/52 (3.0) | 11.83 | WI | v Eng | 3 May 2010 | T20I 158 |
| CRD Fernando | 4.25 | 2/17 (4.0) | ST Jayasuriya | 16.00 | 0/64 (4.0) | 11.75 | SL | v Pak | 17 Sep 2007 | T20I 35 |
| Syed Rasel | 2.50 | 1/10 (4.0) | Mohammad Ashraful | 13.75 | 1/55 (4.0) | 11.25 | Ban | v WI | 13 Sep 2007 | T20I 24 |
| TM Odoyo | 4.66 | 1/14 (3.0) | LN Onyango | 15.25 | 0/61 (4.0) | 10.58 | Kenya | v SL | 14 Sep 2007 | T20I 27 |
| TM Dilshan | 2.28 | 0/8 (3.3) | PDRL Perera | 12.25 | 0/49 (4.0) | 9.96 | SL | v NZ | 26 Dec 2006 | T20I 12 |
| SE Bond | 4.25 | 2/17 (4.0) | IG Butler | 14.00 | 0/42 (3.0) | 9.75 | NZ | v Pak | 12 Nov 2009 | T20I 122 |
| Shahid Afridi | 3.75 | 1/15 (4.0) | Shoaib Akhtar | 13.33 | 0/40 (3.0) | 9.58 | Pak | v SL | 13 Oct 2008 | T20I 76 |
| S Sreesanth | 3.00 | 2/12 (4.0) | Joginder Sharma | 12.33 | 2/37 (3.0) | 9.33 | India | v Aus | 22 Sep 2007 | T20I 45 |
| Abdur Razzak | 4.50 | 1/18 (4.0) | Farhad Reza | 13.75 | 2/55 (4.0) | 9.25 | Ban | v Pak | 2 Sep 2007 | T20I 18 |
| AJ Hall | 5.50 | 3/22 (4.0) | M Ntini | 14.66 | 0/44 (3.0) | 9.16 | SA | v Aus | 24 Feb 2006 | T20I 6 |
| MR Gillespie | 3.47 | 2/11 (3.1) | JDP Oram | 12.50 | 0/50 (4.0) | 9.02 | NZ | v SA | 19 Sep 2007 | T20I 39 |
| TG Southee | 5.50 | 2/22 (4.0) | PA Hitchcock | 14.33 | 2/43 (3.0) | 8.83 | NZ | v Eng | 7 Feb 2008 | T20I 54 |
| JM Anderson | 6.25 | 0/25 (4.0) | AD Mascarenhas | 15.00 | 0/15 (1.0) | 8.75 | Eng | v India | 19 Sep 2007 | T20I 40 |
| JM Anderson | 6.25 | 0/25 (4.0) | SCJ Broad | 15.00 | 0/60 (4.0) | 8.75 | Eng | v India | 19 Sep 2007 | T20I 40 |
| SJ Benn | 6.25 | 0/25 (4.0) | KA Pollard | 15.00 | 0/45 (3.0) | 8.75 | WI | v SL | 10 Jun 2009 | T20I 100 |
| J Botha | 3.75 | 2/15 (4.0) | DW Steyn | 12.50 | 0/50 (4.0) | 8.75 | SA | v Eng | 8 May 2010 | T20I 168 |
| DJG Sammy | 3.00 | 0/3 (1.0) | JE Taylor | 11.75 | 1/47 (4.0) | 8.75 | WI | v Aus | 11 May 2010 | T20I 174 |
| SJ Benn | 3.00 | 1/12 (4.0) | JE Taylor | 11.75 | 1/47 (4.0) | 8.75 | WI | v Aus | 11 May 2010 | T20I 174 |
| Umar Gul | 2.00 | 4/8 (4.0) | Sohail Tanvir | 10.66 | 0/32 (3.0) | 8.66 | Pak | v Aus | 7 May 2009 | T20I 89 |
| M Muralitharan | 3.25 | 1/13 (4.0) | KMDN Kulasekara | 11.75 | 1/47 (4.0) | 8.50 | SL | v Ire | 14 Jun 2009 | T20I 108 |
| WB Rankin | 2.75 | 0/11 (4.0) | DT Johnston | 11.25 | 1/45 (4.0) | 8.50 | Ire | v Pak | 15 Jun 2009 | T20I 110 |
The Test innings with the largest difference in economy rate between two bowlers is a recent one. Peter Siddle took 1 for 67 in 35 overs at an economy rate of 1.91 against South Africa at Newlands in 2009. Australian legspinner Bryce McGain was making his debut in that match and the South African batsmen clobbered 149 runs in his 18 overs at an economy rate of 8.27, 6.36 more than that of Siddle.
| Player | Econ | Figures | Player | Econ | Figures | Diff | Team | Oppn | Date | Scorecard | |||
|---|---|---|---|---|---|---|---|---|---|---|---|---|---|
| PM Siddle | 1.91 | 1/67 (35.0) | BE McGain | 8.27 | 0/149 (18.0) | 6.36 | Aus | v SA | 19 Mar 2009 | Test 1916 | |||
| LR Gibbs | 1.56 | 1/25 (16.0) | SC Stayers | 7.36 | 1/81 (11.0) | 5.80 | WI | v India | 23 Mar 1962 | Test 527 | |||
| GR Dilley | 1.67 | 3/47 (28.0) | RGD Willis | 7.07 | 1/99 (14.0) | 5.39 | Eng | v WI | 10 Jul 1980 | Test 882 | |||
| DR Pringle | 2.00 | 0/26 (13.0) | RGD Willis | 6.83 | 2/123 (18.0) | 4.83 | Eng | v WI | 12 Jul 1984 | Test 991 | |||
| CR Matthews | 3.21 | 1/37 (11.3) | AA Donald | 8.00 | 1/96 (12.0) | 4.78 | SA | v Eng | 18 Aug 1994 | Test 1266 | |||
| RW McLeod | 1.90 | 2/78 (41.0) | GHS Trott | 6.66 | 1/80 (12.0) | 4.76 | Aus | v Eng | 24 Mar 1892 | Test 38 | |||
| Mohammad Rafique | 3.65 | 1/150 (41.0) | Shahadat Hossain | 8.41 | 0/101 (12.0) | 4.75 | Ban | v Eng | 26 May 2005 | Test 1751 | |||
| ARC Fraser | 1.77 | 3/39 (22.0) | DE Malcolm | 6.50 | 2/65 (10.0) | 4.72 | Eng | v India | 26 Jul 1990 | Test 1148 | |||
| CR Miller | 1.10 | 1/11 (10.0) | JN Gillespie | 5.73 | 5/88 (15.2) | 4.63 | Aus | v Eng | 28 Nov 1998 | Test 1431 | |||
| PR Adams | 2.72 | 2/49 (18.0) | L Klusener | 7.33 | 1/88 (12.0) | 4.61 | SA | v India | 2 Jan 1997 | Test 1349 | |||
| AV Bedser | 1.46 | 4/37 (19.0x8) | DVP Wright | 5.90 | 0/63 (8.0x8) | 4.44 | Eng | v Aus | 22 Dec 1950 | Test 328 | |||
| JE Emburey | 2.29 | 3/62 (27.0) | JG Thomas | 6.73 | 0/101 (15.0) | 4.43 | Eng | v WI | 3 Apr 1986 | Test 1044 | |||
| AR Border | 1.30 | 0/13 (10.0) | MG Hughes | 5.73 | 0/86 (15.0) | 4.43 | Aus | v WI | 3 Feb 1989 | Test 1114 | |||
| WE Hollies | 1.76 | 2/30 (17.0) | TE Bailey | 6.09 | 0/67 (11.0) | 4.32 | Eng | v NZ | 13 Aug 1949 | Test 317 | |||
| TL Goddard | 1.62 | 2/52 (24.0x8) | EJ Barlow | 5.91 | 1/71 (9.0x8) | 4.29 | SA | v Aus | 6 Dec 1963 | Test 548 | |||
| S Sreesanth | 1.33 | 1/16 (12.0) | RP Singh | 5.60 | 1/56 (10.0) | 4.26 | India | v Eng | 27 Jul 2007 | Test 1841 | |||
| CS Martin | 2.46 | 5/37 (15.0) | JEC Franklin | 6.69 | 3/87 (13.0) | 4.22 | NZ | v SA | 5 May 2006 | Test 1801 | |||
| A Nel | 1.67 | 3/29 (17.2) | CK Langeveldt | 5.88 | 1/100 (17.0) | 4.20 | SA | v Aus | 16 Dec 2005 | Test 1777 | |||
| JH Kallis | 1.30 | 0/13 (10.0) | M Ntini | 5.50 | 0/66 (12.0) | 4.20 | SA | v Aus | 3 Jan 2009 | Test 1904 | |||
| Shakib Al Hasan | 2.31 | 2/44 (19.0) | Sajidul Islam | 6.50 | 1/91 (14.0) | 4.18 | Ban | v NZ | 12 Jan 2008 | Test 1861 |
If there's a particular List you would like to see, email us with your comments and suggestions.
Travis Basevi is a cricket statistician and UK Senior Programmer for Cricinfo and other ESPN sports websites. George Binoy is an Assistant Editor at Cricinfo
Read in App
Elevate your reading experience on ESPNcricinfo App.