Periods of extraordinary highs and lows
The largest differences - positive and negative - between a player's average in 20 consecutive innings and his overall career mean
What is the leanest patch Sachin Tendulkar has had in a glittering ODI career? How did Michael Hussey's Test average reach normal proportions after a superhuman start? It's what we've looked at this week: the largest differences - positive and negative - between a player's average in 20 consecutive innings and his overall career mean.
The widest gap between a 20-consecutive-innings mean and a career average belongs to former India batsman Dilip Vengsarkar. He averaged 105.66 in 14 Tests between December 1985 and February 1987, 63.53 runs more than his career figure of 42.13. Vengsarkar, in fact, had a prolific three-year period between December 1985 and November 1988, during which he scored 1851 runs in 21 Tests at an average of 88.14.
Michael Hussey began his career in November 2005 and averaged 80 in his first six Tests. The tour of South Africa in March 2006, however, was the start of his most productive period: Hussey scored 1460 runs in his next 13 Tests at an average of 91.25. At the end of the Sydney Test against India in January 2008, Hussey's career average was 84 after 20 Tests. His fortune was about to change though.
| Player | Start | End | Mat | Runs | Ave | HS | 100 | Career | Runs | Ave | Diff |
|---|---|---|---|---|
| DB Vengsarkar (India) | 13 Dec 1985 | 21 Feb 1987 | 14 | 1268 | 105.66 | 166 | 5 | 1976-1992 | 6868 | 42.13 | 63.53 |
| DB Vengsarkar (India) | 2 Jan 1986 | 13 Mar 1987 | 14 | 1363 | 104.84 | 166 | 6 | 1976-1992 | 6868 | 42.13 | 62.71 |
| HP Tillakaratne (SL) | 29 Aug 2001 | 15 Nov 2002 | 15 | 1010 | 101.00 | 204* | 4 | 1989-2004 | 4545 | 42.87 | 58.12 |
| S Chanderpaul (WI) | 17 May 2007 | 12 Jun 2008 | 11 | 1265 | 105.41 | 136* | 5 | 1994-2009 | 8669 | 48.70 | 56.71 |
| DB Vengsarkar (India) | 26 Sep 1986 | 24 Nov 1988 | 15 | 1371 | 97.92 | 166 | 6 | 1976-1992 | 6868 | 42.13 | 55.79 |
| Mohammad Yousuf (Pak) | 29 Nov 2005 | 27 Nov 2006 | 12 | 2011 | 105.84 | 223 | 10 | 1998-2010 | 7431 | 53.07 | 52.76 |
| A Flower (Zim) | 1 Jun 2000 | 14 Sep 2001 | 12 | 1530 | 102.00 | 232* | 4 | 1992-2002 | 4794 | 51.54 | 50.45 |
| KC Sangakkara (SL) | 27 Jul 2006 | 3 Apr 2008 | 13 | 1671 | 104.43 | 287 | 7 | 2000-2009 | 7549 | 55.10 | 49.33 |
| DB Vengsarkar (India) | 15 Oct 1986 | 24 Nov 1988 | 14 | 1349 | 89.93 | 166 | 6 | 1976-1992 | 6868 | 42.13 | 47.79 |
| JC Adams (WI) | 2 Jan 1993 | 8 Apr 1995 | 14 | 1220 | 87.14 | 174* | 4 | 1992-2001 | 3012 | 41.26 | 45.88 |
| JC Adams (WI) | 19 Feb 1994 | 21 Apr 1995 | 13 | 1180 | 84.28 | 174* | 4 | 1992-2001 | 3012 | 41.26 | 43.02 |
| Mohammad Yousuf (Pak) | 13 Jan 2006 | 19 Jan 2007 | 12 | 1820 | 95.78 | 202 | 9 | 1998-2010 | 7431 | 53.07 | 42.71 |
| Shoaib Mohammad (Pak) | 10 Feb 1989 | 23 Nov 1990 | 14 | 1387 | 86.68 | 203* | 6 | 1983-1995 | 2705 | 44.34 | 42.34 |
| HP Tillakaratne (SL) | 13 Nov 2001 | 25 Apr 2003 | 14 | 1014 | 84.50 | 204* | 4 | 1989-2004 | 4545 | 42.87 | 41.62 |
| GS Sobers (WI) | 26 Feb 1958 | 28 Jan 1960 | 13 | 1583 | 98.93 | 365* | 7 | 1954-1974 | 8032 | 57.78 | 41.15 |
| JC Adams (WI) | 30 Jan 1993 | 8 Apr 1995 | 13 | 1146 | 81.85 | 174* | 4 | 1992-2001 | 3012 | 41.26 | 40.59 |
| S Chanderpaul (WI) | 4 Jun 2004 | 13 Jul 2005 | 12 | 1330 | 88.66 | 203* | 5 | 1994-2009 | 8669 | 48.70 | 39.96 |
| MEK Hussey (Aus) | 24 Mar 2006 | 2 Jan 2008 | 13 | 1460 | 91.25 | 182 | 5 | 2005-2010 | 3912 | 52.16 | 39.09 |
| HP Tillakaratne (SL) | 14 Aug 2001 | 28 Jul 2002 | 15 | 892 | 81.09 | 204* | 3 | 1989-2004 | 4545 | 42.87 | 38.21 |
| SR Waugh (Aus) | 31 Mar 1995 | 25 Jan 1997 | 13 | 1245 | 88.92 | 200 | 4 | 1985-2004 | 10927 | 51.06 | 37.86 |
In 20 innings between November 28, 2008 and August 20, 2009, Hussey scored only 442 runs in 12 Tests at an average of 23. He had four half-centuries, a high score of 70, and five ducks. It was the leanest 20-innings stretch of his career after which his career average fell to 52.65. It is presently 52.16.
Sri Lanka's Thilan Samaraweera endured his worst run before his best. He went 20 consecutive innings spread between December 2005 and April 2008 averaging 20.50. The turnaround was around the corner, though, and Samaraweera averaged 85.47 in 12 Tests between July 2008 and August 2009, 34 runs more than his career average.
Inzamam-ul-Haq ended his career with an average of 49.60, two runs short of becoming Pakistan's highest runscorer in Tests. His most torturous run was between December 1997 and March 1999, when he scored 328 runs in 20 innings at an average of 17.26.
| Player | Start | End | Mat | Runs | Ave | HS | 100 | Career | Runs | Ave | Diff |
|---|---|---|---|---|
| WR Hammond (Eng) | 12 Aug 1933 | 29 Jun 1935 | 12 | 430 | 22.63 | 47 | 0 | 1927-1947 | 7249 | 58.45 | -35.82 |
| WR Hammond (Eng) | 22 Jul 1933 | 29 Jun 1935 | 13 | 437 | 23.00 | 47 | 0 | 1927-1947 | 7249 | 58.45 | -35.45 |
| WR Hammond (Eng) | 24 Jun 1933 | 15 Jun 1935 | 13 | 439 | 23.10 | 47 | 0 | 1927-1947 | 7249 | 58.45 | -35.35 |
| Inzamam-ul-Haq (ICC/Pak) | 6 Dec 1997 | 4 Mar 1999 | 12 | 328 | 17.26 | 97 | 0 | 1992-2007 | 8830 | 49.60 | -32.34 |
| Inzamam-ul-Haq (ICC/Pak) | 14 Feb 1998 | 4 Mar 1999 | 11 | 328 | 17.26 | 97 | 0 | 1992-2007 | 8830 | 49.60 | -32.34 |
| TT Samaraweera (SL) | 2 Dec 2005 | 3 Apr 2008 | 12 | 369 | 20.50 | 65 | 0 | 2001-2009 | 3938 | 51.14 | -30.64 |
| JH Kallis (ICC/SA) | 14 Dec 1995 | 19 Mar 1998 | 13 | 487 | 24.35 | 101 | 1 | 1995-2010 | 10843 | 54.76 | -30.41 |
| R Dravid (ICC/India) | 26 Mar 2008 | 11 Dec 2008 | 11 | 453 | 23.84 | 111 | 1 | 1996-2010 | 11395 | 53.75 | -29.90 |
| MEK Hussey (Aus) | 28 Nov 2008 | 20 Aug 2009 | 12 | 442 | 23.26 | 70 | 0 | 2005-2010 | 3912 | 52.16 | -28.89 |
| JH Kallis (ICC/SA) | 2 Jan 1996 | 19 Mar 1998 | 12 | 535 | 26.75 | 101 | 1 | 1995-2010 | 10843 | 54.76 | -28.01 |
| DL Amiss (Eng) | 22 Jun 1967 | 12 Jan 1973 | 11 | 331 | 18.38 | 56 | 0 | 1966-1977 | 3612 | 46.30 | -27.91 |
| WR Hammond (Eng) | 22 Jun 1934 | 27 Jul 1935 | 12 | 557 | 30.94 | 87* | 0 | 1927-1947 | 7249 | 58.45 | -27.51 |
| DL Amiss (Eng) | 18 Aug 1966 | 12 Jan 1973 | 12 | 340 | 18.88 | 56 | 0 | 1966-1977 | 3612 | 46.30 | -27.41 |
| JH Kallis (ICC/SA) | 3 Apr 2008 | 6 Mar 2009 | 13 | 573 | 28.65 | 132 | 1 | 1995-2010 | 10843 | 54.76 | -26.11 |
| MJ Clarke (Aus) | 26 Nov 2004 | 3 Nov 2005 | 14 | 512 | 25.60 | 91 | 0 | 2004-2010 | 4375 | 51.47 | -25.87 |
| JH Kallis (ICC/SA) | 29 Feb 2008 | 3 Jan 2009 | 13 | 550 | 28.94 | 132 | 1 | 1995-2010 | 10843 | 54.76 | -25.81 |
| RT Ponting (Aus) | 23 Nov 2000 | 16 Aug 2001 | 12 | 535 | 29.72 | 144 | 1 | 1995-2010 | 11928 | 55.22 | -25.50 |
| VVS Laxman (India) | 14 Mar 1997 | 2 Jan 2000 | 12 | 425 | 21.25 | 95 | 0 | 1996-2010 | 7136 | 46.64 | -25.39 |
| V Sehwag (ICC/India) | 21 Jan 2006 | 26 Dec 2006 | 11 | 537 | 28.26 | 180 | 1 | 2001-2010 | 6691 | 53.52 | -25.26 |
| MD Crowe (NZ) | 26 Feb 1982 | 16 Mar 1984 | 12 | 384 | 20.21 | 100 | 1 | 1982-1995 | 5444 | 45.36 | -25.15 |
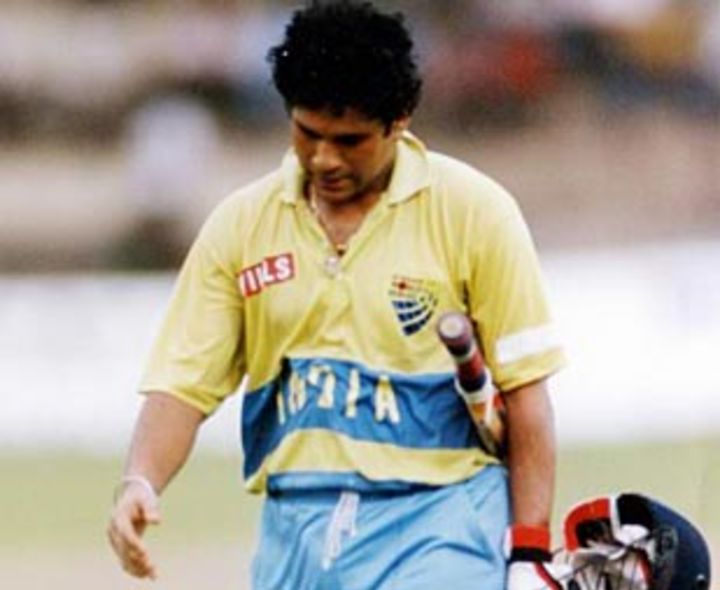
In one-day cricket the worst difference between a career average and an average of 20 consecutive innings belongs to Tendulkar. He now has 17,598 runs at an average of 45.12 but for 20 innings between January 1993 and March 1994, Tendulkar struggled, scoring 319 runs at an average of 19.75. The last match in that period was the first ODI against New Zealand in Napier in 1993. In the second at Eden Park, Tendulkar opened for the first time in his career, after spending most of his time in the lower-middle order, and blitzed 82 off 49 balls, the beginning of an era.
Hussey features once again in the ODI tables for best and worst difference in batting average between career and 20 consecutive innings. He made his debut on February 1 2004 and in his first 20 innings, Hussey scored six half-centuries, was unbeaten 13 times and averaged 107.71. He now averages 53.71 and the period between February 2007 and 2008 contributed to the decline - 470 runs at an average just under 30.
| Player | Start | End | Mat | Runs | Ave | HS | 100 | Career | Runs | Ave | Diff |
|---|---|---|---|---|
| SR Tendulkar (India) | 21 Jan 1993 | 25 Mar 1994 | 20 | 316 | 19.75 | 52 | 0 | 1989-2010 | 17598 | 45.12 | -25.37 |
| DR Martyn (Aus) | 8 Dec 1992 | 10 Jan 1999 | 20 | 280 | 15.55 | 51* | 0 | 1992-2006 | 5346 | 40.80 | -25.25 |
| KC Sangakkara (Asia/ICC/SL) | 3 Feb 2001 | 12 Apr 2002 | 20 | 218 | 11.47 | 35 | 0 | 2000-2010 | 8152 | 36.55 | -25.08 |
| KC Sangakkara (Asia/ICC/SL) | 17 Jan 2001 | 8 Apr 2002 | 20 | 224 | 11.78 | 35 | 0 | 2000-2010 | 8152 | 36.55 | -24.76 |
| KC Sangakkara (Asia/ICC/SL) | 11 Jan 2001 | 12 Dec 2001 | 20 | 225 | 11.84 | 35 | 0 | 2000-2010 | 8152 | 36.55 | -24.71 |
| KC Sangakkara (Asia/ICC/SL) | 31 Jan 2001 | 9 Apr 2002 | 20 | 225 | 11.84 | 35 | 0 | 2000-2010 | 8152 | 36.55 | -24.71 |
| MEK Hussey (Aus) | 4 Feb 2007 | 29 Feb 2008 | 20 | 470 | 29.37 | 105 | 1 | 2004-2010 | 4136 | 53.71 | -24.33 |
| MEK Hussey (Aus) | 2 Feb 2007 | 24 Feb 2008 | 20 | 471 | 29.43 | 105 | 1 | 2004-2010 | 4136 | 53.71 | -24.27 |
| KC Sangakkara (Asia/ICC/SL) | 17 Dec 2000 | 4 Nov 2001 | 20 | 224 | 12.44 | 35 | 0 | 2000-2010 | 8152 | 36.55 | -24.11 |
| KC Sangakkara (Asia/ICC/SL) | 14 Jan 2001 | 19 Dec 2001 | 20 | 247 | 13.00 | 35 | 0 | 2000-2010 | 8152 | 36.55 | -23.55 |
| KC Sangakkara (Asia/ICC/SL) | 8 Feb 2001 | 17 Apr 2002 | 20 | 260 | 13.00 | 50 | 0 | 2000-2010 | 8152 | 36.55 | -23.55 |
| ST Jayasuriya (Asia/SL) | 4 Jan 1990 | 4 Sep 1992 | 20 | 179 | 8.95 | 32 | 0 | 1989-2009 | 13428 | 32.43 | -23.48 |
| KC Sangakkara (Asia/ICC/SL) | 11 Feb 2001 | 27 Jun 2002 | 20 | 262 | 13.10 | 50 | 0 | 2000-2010 | 8152 | 36.55 | -23.45 |
| MEK Hussey (Aus) | 28 Jan 2007 | 22 Feb 2008 | 20 | 485 | 30.31 | 105 | 1 | 2004-2010 | 4136 | 53.71 | -23.40 |
| DR Martyn (Aus) | 10 Dec 1992 | 13 Jan 1999 | 20 | 296 | 17.41 | 51* | 0 | 1992-2006 | 5346 | 40.80 | -23.39 |
| ST Jayasuriya (Asia/SL) | 25 Apr 1990 | 13 Dec 1992 | 20 | 181 | 9.05 | 32 | 0 | 1989-2009 | 13428 | 32.43 | -23.38 |
| MEK Hussey (Aus) | 21 Jan 2007 | 17 Feb 2008 | 20 | 486 | 30.37 | 105 | 1 | 2004-2010 | 4136 | 53.71 | -23.33 |
| ST Jayasuriya (Asia/SL) | 26 Dec 1989 | 2 Mar 1992 | 20 | 183 | 9.15 | 32 | 0 | 1989-2009 | 13428 | 32.43 | -23.28 |
| KC Sangakkara (Asia/ICC/SL) | 9 Jan 2001 | 11 Dec 2001 | 20 | 240 | 13.33 | 35 | 0 | 2000-2010 | 8152 | 36.55 | -23.22 |
| ST Jayasuriya (Asia/SL) | 18 Feb 1990 | 5 Sep 1992 | 20 | 186 | 9.30 | 32 | 0 | 1989-2009 | 13428 | 32.43 | -23.13 |
Lance Klusener was in remarkable one-day form between 1998 and 2000 and various streaks of his during this period dominate the table of best differences in batting average between a career and 20 successive innings. His best run, though, began on February 20, 1999 and ended on February 2, 2000. During this time he was Man of the Tournament in the World Cup and averaged 151.40 in 20 innings (757 runs with 15 not outs), 110.29 runs more than his final career average of 41.10.
| Player | Start | End | Mat | Runs | Ave | HS | 100 | Career | Runs | Ave | Diff |
|---|---|---|---|---|
| L Klusener (SA) | 20 Feb 1999 | 2 Feb 2000 | 20 | 757 | 151.40 | 103* | 2 | 1996-2004 | 3576 | 41.10 | 110.29 |
| L Klusener (SA) | 27 Jan 1999 | 28 Sep 1999 | 20 | 759 | 126.50 | 103* | 2 | 1996-2004 | 3576 | 41.10 | 85.39 |
| L Klusener (SA) | 2 Feb 1999 | 30 Sep 1999 | 20 | 717 | 119.50 | 103* | 2 | 1996-2004 | 3576 | 41.10 | 78.39 |
| L Klusener (SA) | 17 Feb 1999 | 26 Jan 2000 | 20 | 692 | 115.33 | 103* | 2 | 1996-2004 | 3576 | 41.10 | 74.22 |
| L Klusener (SA) | 26 Mar 1999 | 4 Feb 2000 | 20 | 680 | 113.33 | 101* | 1 | 1996-2004 | 3576 | 41.10 | 72.22 |
| L Klusener (SA) | 7 Feb 1999 | 21 Jan 2000 | 20 | 672 | 112.00 | 103* | 2 | 1996-2004 | 3576 | 41.10 | 70.89 |
| L Klusener (SA) | 21 May 1998 | 5 Jun 1999 | 20 | 744 | 106.28 | 103* | 1 | 1996-2004 | 3576 | 41.10 | 65.18 |
| L Klusener (SA) | 23 May 1998 | 10 Jun 1999 | 20 | 726 | 103.71 | 103* | 1 | 1996-2004 | 3576 | 41.10 | 62.61 |
| L Klusener (SA) | 22 Jan 1999 | 17 Jun 1999 | 20 | 724 | 103.42 | 103* | 1 | 1996-2004 | 3576 | 41.10 | 62.32 |
| L Klusener (SA) | 24 Jan 1999 | 26 Sep 1999 | 20 | 704 | 100.57 | 103* | 1 | 1996-2004 | 3576 | 41.10 | 59.46 |
| MG Bevan (Aus) | 11 Apr 1998 | 14 Apr 1999 | 20 | 882 | 110.25 | 101* | 1 | 1994-2004 | 6912 | 53.58 | 56.66 |
| MG Bevan (Aus) | 14 Apr 1998 | 17 Apr 1999 | 20 | 878 | 109.75 | 101* | 1 | 1994-2004 | 6912 | 53.58 | 56.16 |
| L Klusener (SA) | 14 Feb 1999 | 23 Jan 2000 | 20 | 678 | 96.85 | 103* | 2 | 1996-2004 | 3576 | 41.10 | 55.75 |
| L Klusener (SA) | 27 Mar 1999 | 6 Feb 2000 | 20 | 674 | 96.28 | 101* | 1 | 1996-2004 | 3576 | 41.10 | 55.18 |
| MG Bevan (Aus) | 18 Apr 1998 | 18 Apr 1999 | 20 | 862 | 107.75 | 101* | 1 | 1994-2004 | 6912 | 53.58 | 54.16 |
| MEK Hussey (Aus) | 1 Feb 2004 | 26 Jan 2006 | 20 | 754 | 107.71 | 88* | 0 | 2004-2010 | 4136 | 53.71 | 54.00 |
| L Klusener (SA) | 5 Feb 1999 | 3 Oct 1999 | 20 | 663 | 94.71 | 103* | 2 | 1996-2004 | 3576 | 41.10 | 53.61 |
| MG Bevan (Aus) | 21 Apr 1998 | 24 Apr 1999 | 20 | 834 | 104.25 | 101* | 1 | 1994-2004 | 6912 | 53.58 | 50.66 |
| DR Martyn (Aus) | 19 Jan 2000 | 4 Feb 2001 | 20 | 722 | 90.25 | 144* | 2 | 1992-2006 | 5346 | 40.80 | 49.44 |
| L Klusener (SA) | 13 Apr 1998 | 29 May 1999 | 20 | 716 | 89.50 | 103* | 1 | 1996-2004 | 3576 | 41.10 | 48.39 |
If there's a particular List you would like to see, email us with your comments and suggestions.
George Binoy is a senior sub-editor at Cricinfo
Read in App
Elevate your reading experience on ESPNcricinfo App.