Are left-hand top-order batsmen more successful?
Left-handers have always been considered the more elegant breed among batsmen, but are they also more effective? Here's what the numbers say...
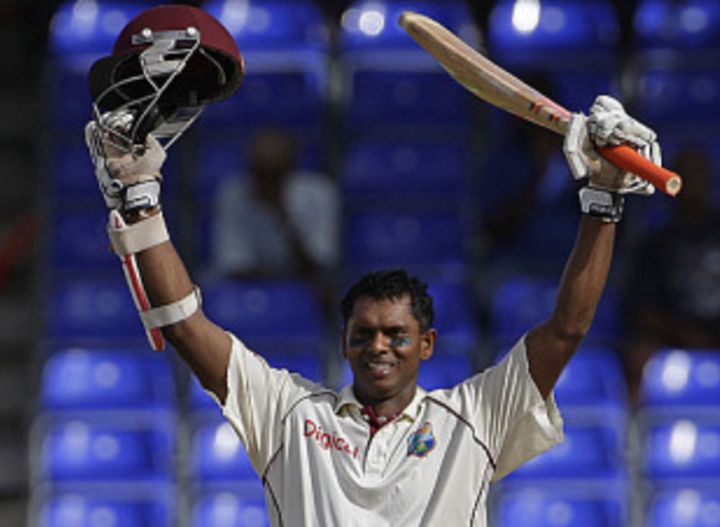
Brian Lara, David Gower and Kumar Sangakkara brought style and grace to batsmanship, Graeme Smith and Matthew Hayden believed more in raw power, Chris Gayle and Adam Gilchrist in unadulterated aggression, while the mantras for Allan Border and Shivnarine Chanderpaul were grit and concentration. Their methods were different, but they've all helped raised the stock of the left-hand batsman over the last few decades. This piece compares their stats with right-handers, decade-wise, team-wise and opposition-wise.
The analyses are restricted to batsmen who played in the top seven in the line-up, to ensure that tailenders - most of whom bat right-handed - don't skew the numbers. It turns out that lefties have consistently done better in all decades from 1970, except the one that started eight months ago. The difference in average had been about a couple of runs in the 1970s, '80s and '90s, but in the 2000s it increased to more than four. In the first eight months of the current decade, though, right-handers have made a spirited fightback, averaging 39.74 to the lefties' 37.53.
The other aspect that stands out is the sheer number of left-handers who have occupied top-order batting slots more recently. Looking at the number of innings played by top-order batsmen, in the 1970s right-handers batted almost four innings for every one played by a left-hander. Over the last 30 years, though, the number has been steadily decreasing every decade: in the 2000s, the ratio had dropped to 1.82, and it has dropped even further, to 1.53, in the first eight months of the current decade. Is it a case of players wisening up to the fact that it pays to be a left-hand batsman?
| Decade | Right-Inngs | Average | 100s | Left-Inngs | Average | 100s | Overall ave | Inngs ratio (R/L) |
| 1970s | 3820 | 36.52 | 287 | 999 | 37.49 | 70 | 36.72 | 3.82 |
| 1980s | 4767 | 35.28 | 328 | 1374 | 37.89 | 106 | 35.86 | 3.47 |
| 1990s | 5949 | 34.71 | 390 | 2315 | 36.97 | 147 | 35.34 | 2.57 |
| 2000s | 7245 | 36.90 | 551 | 3976 | 41.05 | 367 | 38.37 | 1.82 |
| 2010s | 406 | 39.74 | 36 | 265 | 37.53 | 25 | 38.86 | 1.53 |
Looking at the team-wise stats since 2000, it's clear that West Indies have done more than any other team to lift the stock of left-handers. Thanks largely to Lara, Chanderpaul and Gayle, the lefties from the team average more than 40, while the right-handers have fared terribly in comparison, averaging less than 30. The difference is almost as much for Bangladesh and New Zealand as well. New Zealand have Mark Richardson and Stephen Fleming to thank for the high average that their left-handers have managed. Among their right-handers, Ross Taylor is the only one to score more than 1500 runs at a 40-plus average. Some of the others paint a sorry picture: Jamie How, for example, has scored less than 88 runs despite having played 35 innings.
At the other end of the spectrum are Pakistan and India, where right-handers have been the frontrunners. Pakistan's three batting superstars of recent times, Inzamam-ul-Haq, Mohammad Yousuf and Younis Khan, were way ahead of the rest of the batsmen, and they were all right-handers. Since 2000, Pakistan's left-handers have been pretty ordinary, with Imran Farhat, Salman Butt and Taufeeq Umar - the only ones with more than 1000 runs - all averaging less than 40.
Similarly, India's batting giants have mostly been right-handers, with four of them - Tendulkar, Dravid, Sehwag and Laxman - scoring more than 5000 runs at 50-plus averages since 2000. On the other hand, Gautam Gambhir is the only left-hander to have scored more than 1000 at a 50-plus average. Sourav Ganguly and Yuvraj Singh both average less than 40.
Sri Lanka's right-handers average slightly more than their left-hand counterparts too, but the more interesting stat for them is the number of left-hand batsmen who have played for them in the top order since 2000 - 17, compared to only 22 right-handers. For New Zealand, the ratio is nearly 4:1.
| Team | Right-players | Runs | Average | Left-players | Runs | Average | Overall ave |
| Australia | 21 | 29,779 | 48.26 | 13 | 31,107 | 48.45 | 48.36 |
| Bangladesh | 33 | 15,606 | 21.76 | 11 | 5381 | 28.47 | 23.16 |
| England | 34 | 37,533 | 37.38 | 14 | 23,095 | 41.68 | 38.91 |
| India | 34 | 39,999 | 45.29 | 12 | 11,186 | 39.38 | 43.86 |
| New Zealand | 34 | 19,679 | 30.94 | 9 | 11,634 | 38.65 | 33.41 |
| Pakistan | 38 | 31,961 | 39.60 | 14 | 7838 | 32.79 | 38.04 |
| South Africa | 25 | 33,701 | 41.40 | 9 | 17,625 | 44.17 | 42.31 |
| Sri Lanka | 22 | 24,646 | 43.62 | 17 | 19,664 | 40.79 | 42.32 |
| West Indies | 37 | 17,629 | 29.82 | 17 | 27,901 | 40.03 | 35.34 |
| Zimbabwe | 26 | 11,043 | 26.10 | 10 | 4294 | 35.19 | 28.14 |
Have certain teams suffered more at the hands of left-handers than others over the last 10 years? It turns out that South Africa and Sri Lanka have had the most problems with left-hand batsmen, compared to their performance against right-handers. Against South Africa, plenty of left-hand batsmen have done well: Hayden, Lara, Chanderpaul and Sangakkara have all scored 1000-plus runs at averages of more than 50 against them. (Click here for more details.) Among right-handers, Mahela Jayawardene, Ricky Ponting and Virender Sehwag have had plenty of success, but some of the others haven't enjoyed their attack as much: Sachin Tendulkar, Rahul Dravid and Michael Vaughan have played a fair amount of cricket against South Africa, but their averages are much lower than their career numbers.
Against Sri Lanka, Lara stands head and shoulders above anyone else, though Hayden, Fleming and Graham Thorpe are among those who've done well against them. Some of the right-handers have done well too - with Sehwag leading the way - but most have found Muttiah Muralitharan too difficult to handle.
It's often been said that Indian bowlers tend to struggle against left-handers, but according to stats, exactly the opposite seems to be true. Hayden, Chanderpaul, Sangakkara and the irrepressible Andy Flower have hurt India's bowlers plenty of times, but some of the other top names - think Gayle, Gilchrist and Lara - have fared much worse against India than against most other sides. There are plenty of right-handers who've feasted on the Indian bowling attack. (For the full list of left-hand top-order batsmen since 2000, click here, and for right-handers click here.)
| Opposition | Right-runs | Average | 100s | Left-runs | Average | 100s | Overall ave |
| Australia | 33,757 | 31.96 | 52 | 16,907 | 33.08 | 33 | 32.33 |
| Bangladesh | 18,828 | 55.70 | 60 | 11,565 | 59.30 | 34 | 57.02 |
| England | 35,678 | 37.01 | 80 | 23,072 | 36.73 | 52 | 36.90 |
| India | 31,503 | 41.61 | 86 | 19,161 | 38.94 | 47 | 40.56 |
| New Zealand | 21,191 | 36.59 | 47 | 13,740 | 43.61 | 34 | 39.07 |
| Pakistan | 23,700 | 37.14 | 49 | 16,279 | 42.17 | 41 | 39.04 |
| South Africa | 26,961 | 31.27 | 51 | 21,162 | 41.49 | 52 | 35.07 |
| Sri Lanka | 24,997 | 31.32 | 45 | 14,820 | 39.62 | 34 | 33.97 |
| West Indies | 32,541 | 40.93 | 85 | 16,714 | 44.10 | 47 | 41.95 |
| Zimbabwe | 12,482 | 45.72 | 32 | 6051 | 52.61 | 17 | 47.76 |
S Rajesh is stats editor of Cricinfo
Read in App
Elevate your reading experience on ESPNcricinfo App.