Australia's all-round weapon
Shane Watson has been the best allrounder in ODIs since the last World Cup, with a batting average that is twice his bowling average
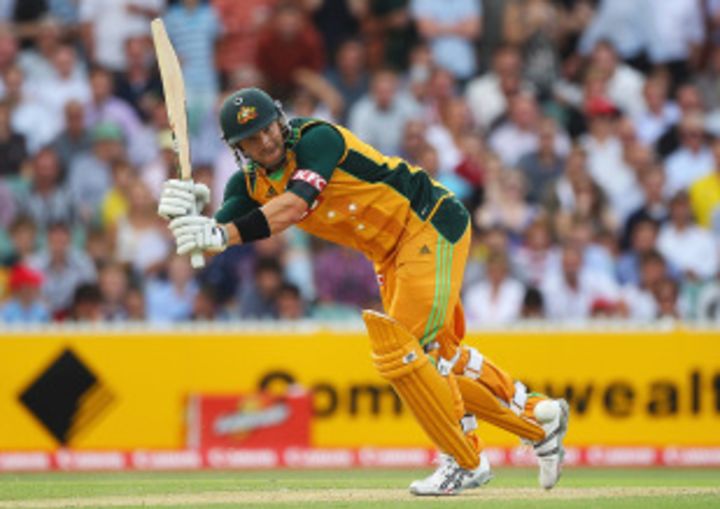
Australia have a few issues to sort out before the start of the World Cup, but the form of their premier allrounder isn't one of them. Shane Watson has been a shining light in both forms of the game this season, and his ability to bat at the top of the order and chip in with his medium pace should give the Australians flexibility in the subcontinent.
For a long time, it seemed Watson would not be able to do justice to his all-round talent due to recurring injuries, but the last few years have been largely injury-free, and he has blossomed. The other change which has made a world of difference is the move to make him open the innings. Till the 2007 World Cup, Watson mostly batted at No.7, and while he didn't do badly at that slot, opening the batting has given him greater opportunities to show his worth as a batsman. And while he has struggled to convert his starts into hundreds in Tests, the centuries have come more easily in ODIs: all five of his ODI hundreds have been scored in the last three years.
More surprisingly, Watson has had more success as a bowler since the last World Cup. He has bowled fewer overs per match in these last three years - about 5.1 overs per match, compared to 6.3 before 2008 - but yet he has averaged more than one wicket per match. The bowling average has fallen drastically - from 34.11 before 2008 to less than 23 in his last 56 matches.
The result of these improvements is that while his batting average was about the same as his bowling average till the end of the 2007 World Cup, in the last three years, his batting average is twice the bowling one. Not surprisingly, several of his match-winning performances have come during this period: of the 11 Man-of-the-Match awards he has won, seven have come since 2008, with the latest one being less than two weeks ago for his stunning unbeaten 161 against England, which helped Australia ease past their target of 295.
| Period | ODIs | Runs | Average | Strike rate | 100s/ 50s | Wickets | Average | Econ rate |
| Till Apr 30, 2007 | 65 | 1001 | 34.51 | 80.01 | 0/ 7 | 62 | 34.11 | 4.89 |
| Since May 1, 2007 | 56 | 2285 | 44.80 | 87.64 | 5/ 11 | 61 | 22.73 | 4.77 |
| Career | 121 | 3286 | 41.07 | 85.17 | 5/ 18 | 123 | 28.47 | 4.84 |
His superb ODI numbers in the last few years clearly make him the leading allrounder in the world in this format. Only six players have achieved the double of 1000 runs and 50 wickets in ODIs since the previous World Cup, and among them Watson clearly has the best stats, with a batting average of almost 45 and a bowling average of under 23. No other allrounder comes close to these numbers. Bangladesh's Shakib Al Hasan is the only other allrounder whose batting average is greater than his bowling one. Yuvraj Singh's batting is clearly his stronger suit, though he has done a fair job of chipping in with a few overs of left-arm spin whenever he's been called to do that job. Shahid Afridi's batting strike rate is outstanding, while his bowling stats are pretty acceptable too.
A couple of prominent allrounders are missing from this list since they don't make the cut of 1000 runs and 50 wickets: Jacques Kallis averages 47.54 with the bat and 34.96 with the ball, but he has only taken 29 wickets in 50 ODIs during this period. Daniel Vettori has a batting average of 24.35 and a bowling one of 26.86, but he only has 755 runs from 64 ODIs.
| Player | ODIs | Runs | Average | Strike rate | 100s/ 50s | Wickets | Average | Econ rate |
| Shane Watson | 56 | 2285 | 44.80 | 87.64 | 5/ 11 | 61 | 22.73 | 4.77 |
| Shakib Al Hasan | 73 | 1969 | 31.75 | 82.66 | 4/ 13 | 100 | 28.30 | 4.38 |
| Yuvraj Singh | 99 | 3141 | 38.30 | 89.10 | 5/ 18 | 52 | 39.96 | 5.15 |
| Shahid Afridi | 70 | 1448 | 26.32 | 130.80 | 2/ 3 | 87 | 34.90 | 4.71 |
| James Hopes | 75 | 1242 | 24.84 | 94.16 | 0/ 3 | 63 | 33.57 | 4.49 |
| Elton Chigumbura | 66 | 1341 | 23.12 | 86.85 | 0/ 7 | 60 | 35.73 | 5.87 |
The move to shift Watson to the top of the order has clearly been a masterstroke. In these three-and-a-half years, he is among the top five openers in terms of averages (with a cut-off of 1000 runs), with only two - Hashim Amla and Tillakaratne Dilshan - getting more hundreds. In 53 innings at the top, he has 16 scores of fifty or more, which is an average of at least a half-century every 3.3 innings. It isn't quite as impressive as Amla's 19 in 39, but it isn't far off from the ratio of most of the other openers.
One of the best attributes of Watson is his ability to get starts almost every time he walks out to bat. Batting against the new ball obviously increases the chances of early dismissals, but it hasn't been so for Watson: in 25 ODI innings since the beginning of 2010, he has been dismissed for less than ten only three times, two of which happened in the ongoing series against England. Before those two dismissals, he had gone 21 consecutive innings without getting out for less than ten.
| Batsman | ODIs | Runs | Average | Strike rate | 100s/ 50s |
| Hashim Amla | 39 | 2131 | 60.88 | 94.33 | 7/ 12 |
| Tillakaratne Dilshan | 42 | 1998 | 52.57 | 101.11 | 7/ 7 |
| Sachin Tendulkar | 60 | 2782 | 50.58 | 88.62 | 5/ 16 |
| Gautam Gambhir | 52 | 2007 | 46.67 | 92.57 | 5/ 13 |
| Shane Watson | 53 | 2215 | 46.14 | 88.38 | 5/ 11 |
| Chris Gayle | 51 | 1961 | 44.56 | 96.17 | 4/ 12 |
| Virender Sehwag | 55 | 2305 | 44.32 | 122.47 | 5/ 12 |
| Salman Butt | 44 | 1763 | 43.00 | 79.37 | 5/ 11 |
One of the other noteworthy aspects about Watson's batting in these last few years has been his ability to bring out his best in run-chases. In the 22 innings when he has batted second, Watson averages more than 62; in the 34 innings when he has batted first, his average drops to 35.33.
Of the five centuries he has hit, four have come in run-chases, with two of them being scored in consecutive games, in the 2009 Champions Trophy semi-final and final, which helped Australia overhaul targets of 258 and 201.
| Batsman | ODIs | Runs | Average | Strike rate | 100s/ 50s |
| Shane Watson | 22 | 1119 | 62.16 | 87.35 | 4/ 4 |
| Virat Kohli | 25 | 1197 | 59.85 | 83.58 | 3/ 9 |
| Jacques Kallis | 26 | 1145 | 57.25 | 82.91 | 1/ 11 |
| Graeme Smith | 25 | 1207 | 54.86 | 85.78 | 2/ 11 |
| Gautam Gambhir | 46 | 2006 | 54.21 | 88.87 | 5/ 12 |
| AB de Villiers | 36 | 1275 | 51.00 | 87.56 | 2/ 9 |
| Tillakaratne Dilshan | 27 | 1039 | 49.47 | 103.79 | 4/ 2 |
| MS Dhoni | 57 | 1614 | 47.47 | 75.63 | 1/ 12 |
One quirk in his batting stats, though, is his stats in wins and losses: Watson has a higher average in matches that Australia have lost, than in wins. In defeats, he averages 48.16; in wins it goes down to 44.92.
Watson the bowler, though, has done much better in wins; in fact, his stats in wins are among the best in the world. In the 42 wins that he has been a part of, Watson has taken 54 wickets at 20.07; in 13 losses, on the other hand, he has taken only seven wickets at 43.28.
| Bowler | ODIs | Wickets | Average | Econ rate |
| Ajantha Mendis | 25 | 61 | 11.65 | 3.70 |
| Abdur Razzak | 21 | 47 | 16.17 | 3.91 |
| Muttiah Muralitharan | 24 | 47 | 16.80 | 4.16 |
| Umar Gul | 24 | 54 | 18.50 | 5.03 |
| Kyle Mills | 23 | 49 | 18.53 | 4.35 |
| James Anderson | 33 | 59 | 20.05 | 4.30 |
| Shane Watson | 42 | 54 | 20.07 | 4.65 |
| Stuart Broad | 33 | 68 | 20.11 | 4.72 |
S Rajesh is stats editor of Cricinfo
Read in App
Elevate your reading experience on ESPNcricinfo App.