The cream of the opening crop
A look at the teams, and batsmen, who have the best records at the top of the order in the last 40 years
Last week's column analysed the performances of No. 3 batsmen in Tests, and one of the findings was that England have been laggards at this position during this period. This time the focus shifts to openers, and England can feel happier about their results at this slot.
Over the last four decades and a bit, only two teams have averaged more than 40 at the opening slot. Australia are one of them, which isn't much of a surprise at all, but along with them are the underrated South Africans, who are on top of the tree with an average of almost 42, which is well clear of Australia's 40.09.
Over the years, the aspect of South African cricket that has been seen as their biggest strength is their fast bowling, which is why this revelation - and the table below - might surprise a few. Barry Richards, arguably the greatest opener the country has produced, played only four Tests and hence didn't do too much to lift the numbers (though he averaged more than 72 in those games), but Graeme Smith, Herschelle Gibbs and Gary Kirsten all scored more than 5000 runs each at the opening slot at 40-plus averages.
The teams who have struggled more than others are New Zealand and Pakistan - they are the only ones among the top eight sides to have sub-35 averages, and New Zealand are the only ones to average less than 30, missing the mark by four runs. Glenn Turner was their most successful opener with an average of more than 48, while Mark Richardson and John Wright did pretty well too, but there were several others who were less than prolific - Matt Horne, Bryan Young and Bruce Edgar all scored more than 1500 runs at an average of less than 33. (Click here for the full list of New Zealand openers during this period.)
| Team | No. of openers | Tests | Runs | Average | 100s/ 50s |
| South Africa | 26 | 185 | 25,859 | 41.84 | 66/ 108 |
| Australia | 57 | 409 | 56,575 | 40.09 | 143/ 262 |
| England | 59 | 445 | 61,005 | 39.61 | 146/ 290 |
| India | 53 | 324 | 41,510 | 38.50 | 94/ 207 |
| West Indies | 56 | 337 | 40,485 | 36.24 | 81/ 198 |
| Sri Lanka | 32 | 195 | 23,208 | 35.48 | 54/ 96 |
| Pakistan | 54 | 293 | 33,971 | 34.91 | 71/ 165 |
| New Zealand | 51 | 264 | 27,746 | 29.99 | 45/ 137 |
| Zimbabwe | 20 | 83 | 7388 | 24.14 | 9/ 43 |
| Bangladesh | 13 | 68 | 6316 | 23.74 | 7/ 32 |
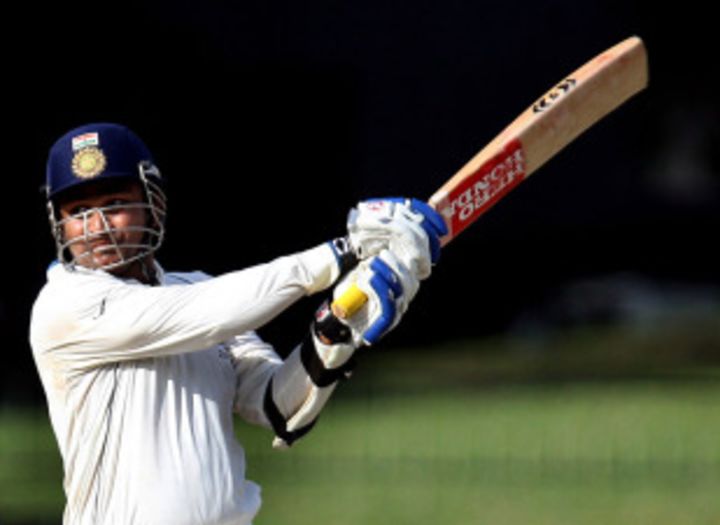
On the other hand, some of the other sides have been blessed with outstanding openers over the last 40 years. Leading the way is the most unconventional of them all, India's Virender Sehwag - he is the only one of the lot to score 3000-plus runs at an average of more than 55. Dennis Amiss, the England opener who played in the late 1960s and '70s, is next on the illustrious list, but what pulled down his stature among all-time England batsmen was his dismal career record against Australia - he averaged 15.25 against them in 21 innings.
Geoff Boycott's overall career average as opener was 48.16, but in the period under consideration - 1970 onwards - he averaged 51.23, with 16 hundreds in 66 matches, which was a touch higher than his biggest rival, Sunil Gavaskar. In the top 10, there are two representatives each from India, England, South Africa and Australia, and one each from Pakistan and West Indies. England also occupy four of the next five positions (Vaughan, Stewart, Gooch and Trescothick), while Sri Lanka's top spot is taken by Marvan Atapattu, who averaged 43.22 in 79 Tests. (Click here for the full list.)
| Batsman | Tests | Runs | Average | 100s/ 50s |
| Virender Sehwag | 74 | 6660 | 55.50 | 20/ 20 |
| Dennis Amiss | 39 | 3274 | 53.70 | 11/ 9 |
| Graeme Smith | 83 | 6935 | 51.75 | 21/ 26 |
| Geoff Boycott | 66 | 5482 | 51.23 | 16/ 29 |
| Matthew Hayden | 103 | 8625 | 50.73 | 30/ 29 |
| Sunil Gavaskar | 119 | 9607 | 50.29 | 33/ 42 |
| Justin Langer | 65 | 5112 | 48.22 | 16/ 18 |
| Herschelle Gibbs | 68 | 5242 | 47.22 | 14/ 21 |
| Saeed Anwar | 54 | 3957 | 47.10 | 11/ 25 |
| Roy Fredericks | 48 | 3804 | 46.39 | 8/ 22 |
South Africa's best openers have been Smith and Gibbs, but Kirsten did well too over a long career, and the overall numbers for the team remain high as the support cast have also done a pretty good job: Neil McKenzie averages almost 40, while both AB de Villiers and Andrew Hudson - the only other openers to score 1000 or more runs - average at least 45.
| Batsman | Tests | Runs | Average | 100s/ 50s |
| Graeme Smith | 82 | 6923 | 52.44 | 21/ 26 |
| Herschelle Gibbs | 68 | 5242 | 47.22 | 14/ 21 |
| Gary Kirsten | 84 | 5726 | 41.79 | 14/ 28 |
| Neil McKenzie | 20 | 1279 | 39.96 | 3/ 3 |
| AB de Villiers | 20 | 1265 | 36.14 | 3/ 6 |
| Andrew Hudson | 31 | 1855 | 35.00 | 4/ 12 |
At the lower end of the scale are Pakistan. Their struggles to find a worthy opener have been well documented, and the list below indicates how desperate their situation is: among their openers who have scored at least 1000 runs, their current ones, Imran Farhat and Salman Butt, have the lowest averages. Saeed Anwar was outstanding during his pomp, and along with Aamer Sohail gave Pakistan one of their most stable opening combinations, but since then the cupboard's been pretty bare. Taufeeq Umar showed some promise but hasn't played for Pakistan in the last four years, while the rest haven't been a patch on Anwar.
| Batsman | Tests | Runs | Average | 100s/ 50s |
| Saeed Anwar | 54 | 3957 | 47.10 | 11/ 25 |
| Majid Khan | 26 | 1985 | 42.23 | 5/ 7 |
| Shoaib Mohammad | 27 | 1423 | 40.65 | 4/ 5 |
| Taufeeq Umar | 25 | 1729 | 39.29 | 4/ 9 |
| Mohsin Khan | 43 | 2455 | 37.76 | 7/ 9 |
| Mudassar Nazar | 70 | 3787 | 36.76 | 9/ 15 |
| Aamer Sohail | 46 | 2630 | 36.02 | 4/ 13 |
| Sadiq Mohammad | 38 | 2317 | 35.64 | 5/ 8 |
| Rameez Raja | 43 | 2103 | 32.85 | 1/ 17 |
| Imran Farhat | 39 | 2327 | 31.87 | 3/ 14 |
| Salman Butt | 31 | 1742 | 31.10 | 3/ 10 |
In the list of top 10 batsmen, five have played their cricket predominantly in the 2000s, but the overall decade-wise averages indicate that the increase in the 2000s over the previous decade isn't that much - unlike in the case of the No. 3s, when the increase was significant. For the openers, the growth in averages is only 4.9%, which is less than the overall increase in batting averages during this decade. Clearly the openers haven't got a large chunk of the overall batting bounty that has been witnessed over the last 10 years.
| Decade | Tests | Runs | Average | 100s/ 50s | Overall decade ave |
| 1970s | 198 | 52,391 | 38.29 | 120/ 252 | 30.76 |
| 1980s | 266 | 61,121 | 34.76 | 129/ 290 | 30.45 |
| 1990s | 347 | 83,794 | 35.50 | 171/ 408 | 29.45 |
| 2000 onwards | 491 | 127,212 | 37.24 | 296/ 589 | 32.08 |
S Rajesh is stats editor of Cricinfo
Read in App
Elevate your reading experience on ESPNcricinfo App.