The mandatory Powerplays, and pace v spin
Have teams approached the first 10 overs with more caution during this World Cup?
These are early days yet in the World Cup, and some of the performances of the weaker teams have tended to skew the overall numbers emerging from the tournament. Ireland and Netherlands have had one fantastic game each, but there have also been some desperately one-sided contests, which makes it slightly tricky to talk about trends emerging from the World Cup. There's been some talk, though, of teams approaching the early overs cautiously, in a throwback to the way the game was played a few years ago. Let's check if that's indeed been the case, with teams perhaps being mindful of the pressures of the tournament.
In the first 15 matches of this World Cup, the overall average run rate at the end of 10 overs is 5.12, while the average runs per wicket is 42.38. Thanks to the relative strengths of the teams in some of these matches, the range has been quite a bit. The highest has been Sri Lanka's 81 for 1 against Kenya, with the bowling team leaking 13 fours in the mandatory Powerplay. There have been four other instances of teams scoring more than 70 in this Powerplay, of which two have been in matches involving two of the top nine teams: England scored 77 in that tied game against India, while Australia made 74 during their comfortable run-chase against New Zealand.
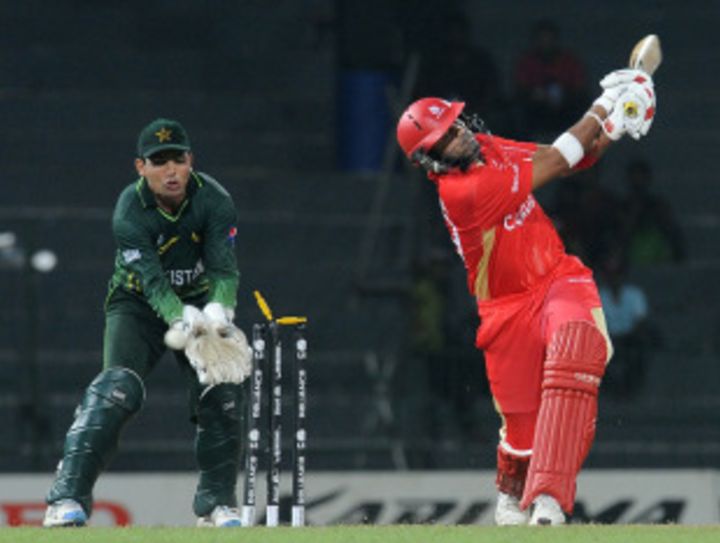
At the other end of the scale are Canada's performances in their three matches so far: 14 for 3 against Zimbabwe, 20 for 3 versus Sri Lanka, and 25 for 2 against Pakistan. Those are three of the poorest performances in the mandatory Powerplay. There have been nine instances of teams scoring less than 40 in the first 10 (including the matches on March 3), but only once was the batting team one of the top sides: in their first match of the tournament, Australia crawled to 28 without loss against Zimbabwe, playing out 39 dot balls in the first 10 overs.
| Runs | Wickets | Average | Run rate | |
| Teams batting first | 758 | 15 | 50.53 | 5.05 |
| Teams batting second | 768 | 21 | 36.57 | 5.18 |
| Overall | 1526 | 36 | 42.38 | 5.12 |
Obviously, the overall run-rate shown in the table above falls because of the performances of the lesser teams. Exclude their batting performances, and the run-rate goes up to 5.93, with the teams batting second doing particularly well. That's also to some extent because of the matches when the top teams have had to chase low targets against the minnows, situations which have given the top batsmen the license to go after the bowling without too much pressure.
| Runs | Wickets | Average | Run rate | |
| Teams batting first | 600 | 9 | 66.67 | 5.45 |
| Teams batting second | 516 | 5 | 103.20 | 6.61 |
| Overall | 1116 | 14 | 79.71 | 5.93 |
If it's true, though, that teams have been more circumspect at the start in this tournament, then the run rates should be higher in the first 10 in ODIs played over the last year or two. As the table below shows, that isn't the case; the run rates for the top nine teams are only slightly over five since the beginning of 2009 and 2010, which is consistent with the overall numbers for the World Cup so far.
The overall record in the first 10 since the beginning of 2009 is New Zealand's 95 for 1 against West Indies in Napier in January 2009. That match, though, was affected by rain, and New Zealand batted only 35 overs. In a full 50-over innings, the highest is Sri Lanka's 86 for 1 against India in Cuttack. Despite such a frenetic start, Sri Lanka folded up for 239 and ended up losing quite comfortably, by seven wickets.
It's not surprising that the highest total in the first 10 has been scored in India, given the flat pitches and quick outfields at most venues, but even in India the overall average run rate in these overs is only 5.39, which suggests things aren't much different in this World Cup.
| Runs | Wickets | Average | Run rate | |
| Overall, since Jan 2009 | 27,629 | 795 | 34.75 | 4.90 |
| Top 9 teams, since Jan 2009 | 22,214 | 599 | 37.08 | 5.02 |
| Overall, since Jan 2010 | 14,303 | 395 | 36.21 | 4.97 |
| Top 9 teams, since Jan 2010 | 11,592 | 302 | 38.38 | 5.14 |
The numbers for the bowling Powerplay are slightly different, with the overall average and run rate being much lower than in the mandatory Powerplay. However, the top nine teams have done much better, with the stats being especially impressive for teams batting second.
| Runs | Wickets | Average | Run rate | |
| Teams batting first | 391 | 14 | 27.92 | 4.60 |
| Teams batting second | 306 | 9 | 34.00 | 4.37 |
| Overall | 697 | 23 | 30.30 | 4.50 |
| Runs | Wickets | Average | Run rate | |
| Teams batting first | 282 | 8 | 35.25 | 5.12 |
| Teams batting second | 174 | 1 | 174.00 | 5.80 |
| Overall | 456 | 9 | 50.66 | 5.36 |
Afridi flies the spin flag
Shahid Afridi has been keeping the flag flying for the spinners in the 2011 World Cup, but the rest of the slow bowlers haven't been having such a great time so far. Afridi has taken 14 wickets at an incredible average of 5.21, and is by a distance the leading wicket-taker of the 2011 World Cup, six clear of Mitchell Johnson. However, eight of the next 11 positions after Afridi are occupied by fast bowlers. South Africa's Imran Tahir has been the other standout spinner, but overall, fast bowlers have taken more wickets than spinners, and at a better average. Spinners have a better economy rate, but that's also because they tend to bowl most of their overs during the middle of innings, when teams are usually in consolidation mode.
Afridi is more than halfway towards equalling Glenn McGrath's haul of 26 in 2007, which is the highest in a World Cup. He may or may not touch McGrath's mark, but by the end of this World Cup he will almost certainly be Pakistan's highest wicket-taker in a World Cup - he needs only five more to exceed Wasim Akram's 18 in 1992.
| Wickets | Average | Economy rate | |
| Pace | 142 | 29.66 | 5.39 |
| Spin | 100 | 33.53 | 4.89 |
| Spin excl. Afridi | 86 | 38.14 | 4.99 |
S Rajesh is stats editor of Cricinfo
Read in App
Elevate your reading experience on ESPNcricinfo App.