The top players in the middle overs
Indians and South Africans have been the best at handling the challenges of the middle overs in ODIs
The batsmen should largely enjoy the conditions of the subcontinent in the 2011 World Cup, but one aspect that will probably challenge many of them is the middle overs. Overs 16 to 40 of an innings are often the least exciting period of an ODI, with batsmen consolidating and preparing for the late onslaught, and the fielding team looking to get the quota of fifth-bowler overs out of the way. They're often the periods with the least drama, but in terms of the context of games, they're crucial, not least because they constitute half the number of overs available to a team.
In the subcontinent, the middle overs can sometimes present a greater challenge to batsmen because of the condition of the pitch and the ball: the slow track and the soft ball is a combination that can defeat the best intentions to inject momentum into an innings. Apart from scoring reasonably quickly, teams also need to ensure they don't lose too many wickets during this period, so that they still have resources in hand for the end overs. Here's a look at the teams and the players who've been the best performers during this period of an innings.
The two teams that really made the middle overs count over the last couple of years are India and South Africa. On current form they're the two best batting sides in the World Cup, and their exceptional middle-order talent has made it extremely difficult for opposition bowlers to contain them. Both these sides have scored at well over five runs per over, and at the same time they've managed it without losing too many wickets, averaging more than 43 runs per wicket. As bowling units, both India and South Africa have been reasonably economical, and have also taken wickets regularly, averaging less than 35 runs per wicket. On average, they've thus won most of their middle-over battles, which means they're likely to win games even if they only keep pace with the opposition in the other two stages of the game - the first 15 and the last ten.
Australia have been superb in most aspects of their game in ODIs, but in the middle overs they have tended to bat somewhat conservatively, averaging only 4.78 runs per over. Their batting average is pretty good, though, which means they tend to keep their wickets in hand for the last ten overs.
The Indians also dominate the list of most runs scored in these middle overs - they figure in three of the top four. The top two in the list were both from the same game, a spectacular high-scoring match between India and Sri Lanka in Rajkot in which both teams scored more than 400. It's hardly surprising that both teams topped 200 in the middle in that match: India made 228 for 4, while Sri Lanka responded with 213 for 4 in the 25 overs between 26 and 40. The only other instance when a team scored more than 200 in these overs over the last two years was in Christchurch, when India amassed 206 for 1 on the way to a 50-over score of 392. South Africa's highest is 186, against Zimbabwe in Benoni in October 2010.
| Teams | Bat ave | Run rate | Bowl ave | Econ rate | Ave diff | ER diff |
| India | 43.41 | 5.45 | 34.51 | 5.03 | 8.90 | 0.42 |
| South Africa | 44.84 | 5.26 | 32.58 | 4.97 | 12.26 | 0.29 |
| Pakistan | 30.48 | 4.84 | 33.44 | 4.57 | -2.96 | 0.27 |
| England | 37.58 | 4.88 | 34.15 | 4.82 | 3.43 | 0.06 |
| West Indies | 28.07 | 4.85 | 39.25 | 4.79 | -11.18 | 0.06 |
| Australia | 40.59 | 4.78 | 31.62 | 4.76 | 8.97 | 0.02 |
| New Zealand | 27.69 | 4.83 | 36.19 | 4.87 | -8.50 | -0.04 |
| Sri Lanka | 36.75 | 4.84 | 31.66 | 4.94 | 5.09 | -0.10 |
| Bangladesh | 35.07 | 4.52 | 38.08 | 4.68 | -3.01 | -0.16 |
| Zimbabwe | 27.58 | 4.15 | 33.61 | 4.67 | -6.03 | -0.52 |
One of the key aspects that could decide the fortune of teams in this World Cup is their ability to play spin, especially in the middle overs. As the table below shows, the Indians have been particularly adept at it, which is hardly surprising, averaging almost 54 runs per wicket, easily the best among all teams. South Africa have done pretty well too, but the run rate against spin has dropped for some of the other teams, including Sri Lanka and Australia. Sri Lanka's average against spin is much higher, which shows they don't lose too many wickets against spin, but against Australia spin in the middle overs is clearly the correct strategy - their run-rate drops to 4.51, which is much lower than their scoring rate against fast and medium-fast bowling.
| Team | v pace - average | Run rate | v spin - average | Run rate |
| India | 36.74 | 5.70 | 53.82 | 5.24 |
| South Africa | 40.70 | 5.29 | 48.94 | 5.23 |
| England | 33.94 | 4.79 | 42.00 | 5.00 |
| Pakistan | 28.00 | 4.71 | 32.70 | 4.93 |
| New Zealand | 26.91 | 4.86 | 28.18 | 4.80 |
| Sri Lanka | 28.36 | 5.17 | 43.84 | 4.66 |
| West Indies | 24.47 | 5.22 | 33.36 | 4.61 |
| Australia | 41.98 | 5.08 | 39.27 | 4.51 |
| Bangladesh | 37.26 | 4.83 | 33.63 | 4.32 |
| Zimbabwe | 24.61 | 4.46 | 27.68 | 3.98 |
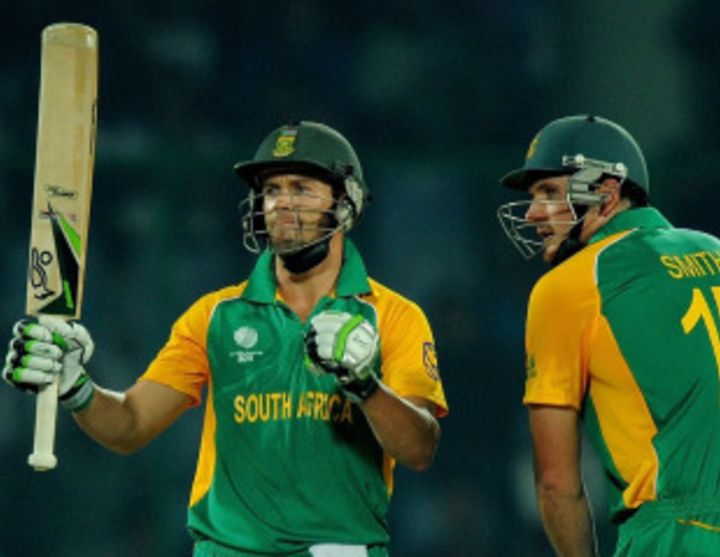
Indians and South Africans also share the honours for best batsmen in the middle overs. They occupy six of the top seven positions, with Michael Hussey being the only one from any other team to sneak in. AB de Villiers takes top spot with an outstanding average of 74.25, and a strike rate of very nearly a run a ball, which shows he is able to control the middle overs and score at a fast pace without taking too many risks. The key to that is his exceptionally low dot-ball percentage: he is one of only two batsmen with a dot-ball percentage of less than 40. That means he is able to manoeuvre the ball around so well that he is seldom under pressure in the middle overs. (And remember, these numbers exclude Thursday's match against West Indies, when he scored 69 off 67 in the middle overs, with only 23 dot balls.)
The other batsman with a sub-40% dot-ball percentage is Hashim Amla, but, as an opener, he has the advantage of having established himself at the crease by the time the middle overs come along.
Among the other batsmen, Virat Kohli's numbers are impressive: his average and run-rate are very high, and his dot-ball percentage is low. Suresh Raina's run-rate is high too, but his average has dropped off slightly due to a relatively poor series in South Africa.
| Batsman | Runs | Balls | Dismissals | Average | Run rate | Ave x RR/6 | Dot ball % |
| AB de Villiers | 1485 | 1493 | 20 | 74.25 | 5.96 | 73.76 | 36.44 |
| Virat Kohli | 1021 | 1114 | 16 | 63.81 | 5.49 | 58.39 | 42.19 |
| Hashim Amla | 736 | 813 | 12 | 61.33 | 5.43 | 55.50 | 33.70 |
| Michael Hussey | 1228 | 1528 | 19 | 64.63 | 4.82 | 51.92 | 43.98 |
| MS Dhoni | 1362 | 1739 | 21 | 64.85 | 4.69 | 50.69 | 47.33 |
| JP Duminy | 635 | 848 | 10 | 63.50 | 4.49 | 47.52 | 43.16 |
| Suresh Raina | 889 | 951 | 18 | 49.38 | 5.60 | 46.09 | 44.69 |
| Shivnarine Chanderpaul | 574 | 774 | 10 | 57.40 | 4.44 | 42.48 | 46.77 |
| Shakib Al Hasan | 1126 | 1291 | 24 | 46.91 | 5.23 | 40.89 | 44.31 |
| Umar Akmal | 674 | 830 | 14 | 48.14 | 4.87 | 39.07 | 48.55 |
The list for top ten bowlers is dominated by spinners, which is what you'd expect in the middle overs. Shane Watson and Mitchell Johnson are the only fast bowlers who make the cut, and that's largely because of their wicket-taking ability. In terms of economy rates, three left-arm spinners lead the way, with Ray Price, Daniel Vettori and Shakib Al Hasan all conceding less than four runs per over. Vettori, though, isn't much of a wicket-taker, averaging 38.12 runs per strike. That's probably also because he is part of a weak New Zealand bowling attack, which encourages batsmen to play him out and attack the other bowlers. Among the top spinners, Harbhajan Singh misses out on the top ten list thanks to relatively high average of 37.17 and an economy rate of 4.56.
| Bowler | Balls | Runs conceded | Wickets | Average | Econ rate | Ave x ER/6 |
| Ray Price | 982 | 595 | 25 | 23.80 | 3.63 | 14.40 |
| Shane Watson | 864 | 643 | 26 | 24.73 | 4.46 | 18.38 |
| Shakib Al Hasan | 1625 | 1076 | 37 | 29.08 | 3.97 | 19.24 |
| Graeme Swann | 1164 | 849 | 31 | 27.38 | 4.37 | 19.94 |
| Saeed Ajmal | 1184 | 812 | 27 | 30.07 | 4.11 | 20.60 |
| Mitchell Johnson | 882 | 668 | 24 | 27.83 | 4.54 | 21.06 |
| Daniel Vettori | 1488 | 953 | 25 | 38.12 | 3.84 | 24.40 |
| Shahid Afridi | 2074 | 1563 | 48 | 32.56 | 4.52 | 24.53 |
| Muttiah Muralitharan | 959 | 746 | 23 | 32.43 | 4.66 | 25.19 |
| Nathan Hauritz | 2043 | 1558 | 45 | 34.62 | 4.57 | 26.37 |
S Rajesh is stats editor of Cricinfo
Read in App
Elevate your reading experience on ESPNcricinfo App.