The World Cup in numbers
A statistical analysis of all World Cup tournaments played between 1975 and 2007
It is World Cup time and inevitably, most discussions are centred on the tournament and its history. One of the major talking points when it comes to the World Cup is the format. The early exit of India and Pakistan in 2007 has prompted a completely different design. An increased presence of weaker teams in each group is unfortunate and will undoubtedly render many contests meaningless. In a recent discussion about the World Cup, Deepak Jeyaraman, a good friend and colleague from my graduate school in the US, pointed out that the World Cup stats for both Sachin Tendulkar and Brian Lara are similar when only performances against top teams are considered. He suggested that the overall averages have considerably been boosted because batsmen have amassed plenty against the weaker teams. I found this very interesting and decided to get into the details which revealed some very interesting results and vindicated his statement.
Right from the first World Cup, there have been opportunities provided to smaller teams to compete on the big stage. While this idea is not wrong, it creates many opportunities for batsmen to make hay and register massive scores. In earlier World Cups, there were one or two weaker teams, but in recent times, there have been three or four such teams in every tournament, thus creating every opportunity for batsmen to set records aplenty. Of the 44 scores over 300 in the World Cup, 20 have been made against the weaker teams. Of the 41 times teams have won by a margin of over 100 runs, 21 have come against the minnows. A detailed look into the batting performances of top scorers in World Cups clearly points to a run-glut against the smaller teams.
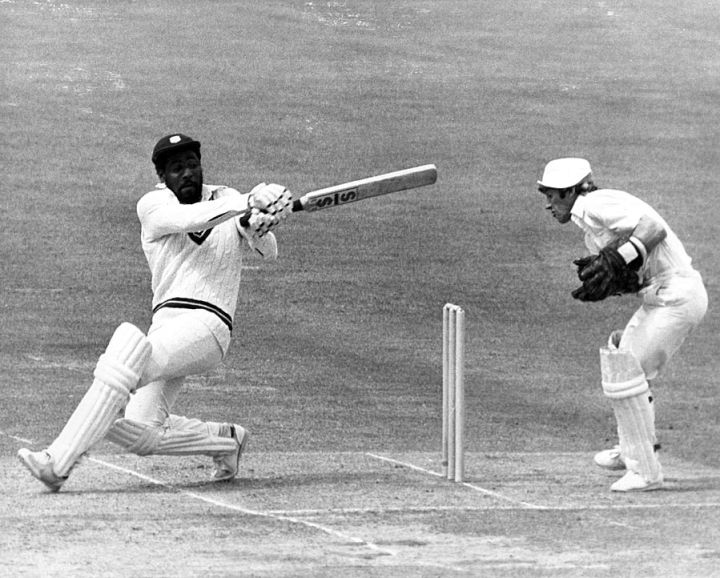
Despite the win over Australia in their first match and the early troubles they caused to India, Zimbabwe were comfortable to beat in the 1983 and 1987 tournaments. They were far more competitive from the 1992 edition onwards. Bangladesh and Kenya have caused ripples, but are not a consistent force in global tournaments. When a minimum of 750 runs against top teams is considered, only Viv Richards makes the cut. His outstanding World Cup career can be appreciated even more because he averages over 66 against top teams during his period. Tendulkar, on the other hand, averages just over 45 against top teams, which is far lower than his overall average of nearly 58. Three of his four hundreds have come against Kenya and Namibia. While Tendulkar has made nearly a third of his World Cup runs against the weaker teams, Sourav Ganguly has scored over 50% of his runs against the minnows. Except in the cases of Ricky Ponting and Lara, the averages of most batsmen have been considerably boosted due to their 'brilliant' batting against the minnows.
**In the 1975-1987 range, ZImbabwe and the other teams like Canada and East Africa are considered weak teams. From 1992-2007, Zimbabwe has been fairly competitive, but along with other smaller teams (Netherlands, Namibia, Scotland, UAE etc), Kenya and Bangladesh, despite an occasional upset, have been classified as weak teams.
| Batsman | Matches | Runs | Average | 100 | 50 | Overall Matches | Overall Runs | Overall Average | 100 | 50 |
| Viv Richards | 20 | 997 | 66.46 | 3 | 5 | 23 | 1013 | 63.31 | 3 | 5 |
| Ricky Ponting | 29 | 1324 | 50.92 | 3 | 6 | 39 | 1537 | 48.03 | 4 | 6 |
| Herschelle Gibbs | 17 | 751 | 50.06 | 2 | 5 | 25 | 1067 | 56.15 | 2 | 8 |
| Mark Waugh | 19 | 774 | 48.37 | 3 | 3 | 22 | 1004 | 52.84 | 4 | 4 |
| Sachin Tendulkar | 28 | 1173 | 45.11 | 1 | 10 | 36 | 1796 | 57.93 | 4 | 13 |
| Brian Lara | 26 | 1005 | 43.69 | 2 | 6 | 34 | 1225 | 42.24 | 2 | 7 |
| Aravinda de Silva | 24 | 767 | 34.86 | 1 | 6 | 35 | 1064 | 36.68 | 2 | 6 |
| Sanath Jayasuriya | 30 | 860 | 30.71 | 2 | 5 | 38 | 1165 | 34.26 | 3 | 6 |
The approach to batting was very different in the early World Cups with scores between 150 and 250 being quite competitive even against top teams. Good bowling conditions and a less aggressive batting style meant that the run rate in the first two World Cups was under four runs per over. The scoring rate went up slightly in the 1983 World Cup as teams began to realize the benefit of faster scoring after playing more ODIs. The 1987 World Cup saw the overall run rate rise to a high of 4.87 because of the excellent batting conditions in the subcontinent. Teams switched to a more conventional approach of preserving wickets in the beginning before accelerating in the final overs in the 1992 edition which saw the advent of field restrictions. Sri Lanka's stunning early-over assaults set the tone for a high-scoring tournament in 1996. The 1999 World Cup in England swung the balance towards the bowlers by providing much more challenging batting conditions. However, the last two tournaments have clearly been in favour of the batsmen. 25 scores over 300 have been made in the 2003 and 2007 World Cup and it seems highly likely that this trend is going to continue.
It is also very interesting to observe the trend of fifty-plus scores, While the 1975 tournament saw a fifty-plus score every six innings, the number went up to one every 8.5 innings in the 1979 tournament. The 1987 World Cup saw the best conversion rate with fifties being scored once in less than six innings. The high figure for the last three editions can be explained by the presence of weaker teams which have struggled to put up substantial scores. The fours-per-match figure is highest for the 1975 World Cup, which is again surprising considering the approach in the early editions. The percentage of boundary runs is also very high and is comparable to later tournaments. The 1992 tournament in Australia saw fewer boundaries per match which is understandable given the size of the grounds in Australia, but since 1996, there has been a consistent increase in the boundary run percentage in each World Cup.
The conversion rate of fifties to centuries was the poorest in the 1979 World Cup with only two centuries being scored compared to 27 half-centuries. The 1996 and 2003 World Cups were the best in terms of the conversion rate with a century every four fifties. However, the 1992 World Cup was another tournament where centuries were far fewer. Only eight of the 92 fifty-plus scores were converted into centuries.
| Year | Matches | Innings | Runs | Runs/innings | 50+ scores | Inns/fifty | 50s:100s | fours/match | Boundary runs | % runs in boundaries | Run rate |
| 1975 | 15 | 258 | 5767 | 22.35 | 41 | 6.29 | 5.83 | 38.33 | 1644 | 42.79 | 3.91 |
| 1979* | 14 | 247 | 4805 | 19.45 | 29 | 8.51 | 13.50 | 26.35 | 2468 | 34.21 | 3.54 |
| 1983* | 27 | 494 | 11024 | 22.31 | 65 | 7.60 | 7.12 | 32.70 | 4288 | 38.89 | 4.08 |
| 1987 | 27 | 478 | 11609 | 24.28 | 80 | 5.97 | 6.27 | 33.85 | 4118 | 35.47 | 4.87 |
| 1992* | 39 | 647 | 13821 | 21.36 | 92 | 7.03 | 10.50 | 28.17 | 4954 | 35.84 | 4.42 |
| 1996* | 36 | 601 | 14239 | 23.69 | 85 | 7.07 | 4.31 | 35.11 | 5944 | 41.74 | 4.67 |
| 1999 | 42 | 737 | 14981 | 20.32 | 86 | 8.56 | 6.81 | 32.78 | 6426 | 42.89 | 4.47 |
| 2003 | 52 | 902 | 18873 | 20.92 | 110 | 8.20 | 4.23 | 34.48 | 8768 | 46.45 | 4.76 |
| 2007 | 51 | 885 | 19800 | 22.37 | 131 | 6.75 | 5.55 | 35.45 | 9470 | 47.82 | 4.95 |
*The number of boundaries is not exact for the 1979, 1983, 1992 and 1996 World Cups
The World Cups held in England have been the best for bowlers. While the 98 matches across the four editions in England have seen 51 hauls of four wickets or more, the 205 matches in the other five World Cups have seen just 77 four-plus wicket hauls. The wickets per match figure is also slightly higher in the four World Cups held in England and is much lower in the two World Cups held in the subcontinent and the 1992 World Cup. On the flip side, the swinging conditions in England made it much more difficult for bowlers to control their line. While the relaxed rules in the early editions were responsible for fewer extras, the tournament in 1999 saw the most extras. Nearly 47 extras were conceded on an average per match in the 1999 World Cup. The first five places on the list of innings with the most extras are from the 1999 World Cup, with India conceding 51 extras in the three-run defeat to Zimbabwe and 44 against Kenya.
| Year | Matches | Wickets | Wickets/match | 4W+ hauls | Total Extras | Extras/match | Economy |
| 1975 | 15 | 194 | 12.93 | 9 | 395 | 26.33 | 3.66 |
| 1979 | 14 | 184 | 13.14 | 7 | 363 | 25.92 | 3.29 |
| 1983 | 27 | 370 | 13.70 | 14 | 1022 | 37.85 | 3.73 |
| 1987 | 27 | 321 | 11.88 | 9 | 913 | 33.81 | 4.66 |
| 1992 | 39 | 447 | 11.46 | 8 | 1286 | 32.97 | 4.24 |
| 1996 | 36 | 411 | 11.41 | 8 | 986 | 27.38 | 4.52 |
| 1999 | 42 | 548 | 13.04 | 21 | 1982 | 47.19 | 4.32 |
| 2003 | 52 | 658 | 12.65 | 35 | 1568 | 30.15 | 4.63 |
| 2007 | 51 | 689 | 13.50 | 17 | 1533 | 30.05 | 4.84 |
Over the years, the number of left handers in teams has constantly increased. In almost every form of cricket, left handers seem to enjoy a distinct advantage and have generally outperformed the right handers. When performances in World Cups are analysed, the numbers are not quite straightforward. While the left-handed batsmen outperformed their counterparts in the first World Cup, they were not quite a force in the second edition. After a far better performance in the 1983 World Cup, their showing in a batting-friendly 1987 edition was much poorer than the right handers who did superbly. Left handers made just six fifty-plus scores in the 1987 World Cup while right handers made over 73. The performances of right handers and left handers was fairly even in the 1992 World Cup, but since then, left-handed batsmen have consistently averaged more and made fifty-plus scores far more consistently. The only anomaly has been the recent World Cup which was again dominated by right handers, who averaged more and scored faster than left handers.
| Year | RHB(players) | Innings | RHB(runs) | RHB(avg) | RHB(50+) | RHB(SR) | Inns/50+ |
| 1975 | 56 | 153 | 4045 | 30.87 | 30 | 58.48 | 5.10 |
| 1979 | 57 | 144 | 3529 | 27.14 | 25 | 55.45 | 5.76 |
| 1983 | 54 | 262 | 6956 | 29.35 | 46 | 60.55 | 5.69 |
| 1987 | 65 | 317 | 9641 | 34.80 | 73 | 75.48 | 4.34 |
| 1992 | 65 | 374 | 9733 | 30.22 | 69 | 66.89 | 5.40 |
| 1996 | 82 | 325 | 8875 | 31.81 | 55 | 71.80 | 5.90 |
| 1999 | 83 | 396 | 8965 | 25.32 | 54 | 63.63 | 7.33 |
| 2003 | 97 | 454 | 10861 | 26.95 | 67 | 72.82 | 6.77 |
| 2007 | 98 | 422 | 11467 | 32.30 | 82 | 77.90 | 5.14 |
| Year | LHB(players) | Innings | LHB(runs) | LHB(avg) | LHB(50+) | LHB(SR) | Inns/50+ |
| 1975 | 13 | 41 | 1088 | 31.08 | 10 | 74.11 | 4.10 |
| 1979 | 13 | 32 | 800 | 30.76 | 4 | 54.86 | 8.00 |
| 1983 | 18 | 91 | 2531 | 33.74 | 17 | 64.45 | 5.35 |
| 1987 | 10 | 43 | 1159 | 28.26 | 6 | 62.04 | 7.16 |
| 1992 | 19 | 120 | 2978 | 28.09 | 23 | 66.22 | 5.21 |
| 1996 | 27 | 138 | 4263 | 36.75 | 30 | 74.96 | 4.60 |
| 1999 | 29 | 156 | 4429 | 34.06 | 29 | 68.46 | 5.37 |
| 2003 | 41 | 207 | 5680 | 32.64 | 38 | 73.69 | 5.44 |
| 2007 | 41 | 240 | 6553 | 30.05 | 49 | 74.98 | 4.89 |
The first three World Cups in England hardly saw spinners being used in most matches. Pace bowlers outperformed spinners comfortably, picking up more wickets at a much better average. The fourth World Cup in 1987 however, was held in the spin-friendly subcontinent. In this edition, the performance of pace bowlers and spinners was much more even. Martin Crowe's remarkable strategy of opening the bowling with a spinner in 1992 stands out in memory in a tournament which was dominated by pace. The 1996 World Cup was the best for spinners as they picked up six hauls of four wickets or more as compared to just two by fast bowlers. 1999 and 2003 were much better for pace bowlers as they picked up 47 four-wicket hauls compared to just nine for spinners. However, the 2007 tournament played on much slower wickets in the Caribbean meant that spinners were quite effective. Going by past records, the 2011 World Cup is again going to be dominated by teams with quality spin options.
| Year | Pace(wickets) | Pace(avg) | Pace(4W+) | Pace(ER) | Spin(wickets) | Spin(avg) | Spin(4W+) | Spin(ER) |
| 1975 | 155 | 27.18 | 8 | 3.63 | 25 | 45.56 | 0 | 3.75 |
| 1979 | 166 | 24.57 | 7 | 3.30 | 8 | 65.25 | 0 | 3.27 |
| 1983 | 310 | 28.59 | 11 | 3.73 | 47 | 36.44 | 3 | 3.61 |
| 1987 | 213 | 36.39 | 7 | 4.84 | 106 | 37.13 | 2 | 4.34 |
| 1992 | 344 | 31.58 | 8 | 4.23 | 94 | 35.29 | 0 | 4.16 |
| 1996 | 228 | 37.45 | 2 | 4.52 | 168 | 32.94 | 6 | 4.47 |
| 1999 | 461 | 27.72 | 18 | 4.23 | 87 | 40.00 | 3 | 4.64 |
| 2003 | 482 | 27.70 | 29 | 4.67 | 186 | 32.13 | 6 | 4.55 |
| 2007 | 454 | 31.37 | 12 | 4.85 | 197 | 32.36 | 5 | 4.79 |
The last table looks at dismissal stats from the World Cups. While the number of bowled and leg before dismissals per match has been definitely higher in the tournaments in England owing to the bowling conditions, the tournaments in the subcontinent have seen fewer lbw dismissals per match. The number of catches by a wicketkeeper per match is also far higher in the World Cups played in England and South Africa when compared to those played on the flatter tracks in the subcontinent and the West Indies. Another noticeable factor is the consistent increase in the number of run-out dismissals since the first two World Cups (except the 1975 final, which saw five run outs in the Australia innings) which can be attributed to the fact that batsmen allow fewer dot balls and focus on much more aggressive running.
| Year | Matches | Bowled | Caught(keeper) | LBW | Run-out |
| 1975 | 15 | 64 | 30 | 31 | 14 |
| 1979 | 14 | 50 | 30 | 25 | 18 |
| 1983 | 27 | 86 | 69 | 47 | 38 |
| 1987 | 27 | 101 | 46 | 27 | 64 |
| 1992 | 39 | 97 | 76 | 33 | 67 |
| 1996 | 36 | 107 | 53 | 37 | 63 |
| 1999 | 42 | 116 | 87 | 85 | 49 |
| 2003 | 52 | 133 | 130 | 92 | 45 |
| 2007 | 51 | 138 | 97 | 82 | 67 |
Madhusudhan Ramakrishnan is a sub-editor (stats) at ESPNcricinfo
Read in App
Elevate your reading experience on ESPNcricinfo App.