WACA's third-innings advantage
While teams batting first have won more often than not in the last ten Tests at the WACA, the matches are largely decided on their performances in the second innings
4-1 Australia's win-loss record at the WACA in the last five Tests here. They had lost to South Africa in 2012. In their last ten Tests at this venue, Australia have drawn only one game - against South Africa in 2005 - and won six. Two of their three defeats have been to South Africa and the other to India.
1985 The last and only time Australia lost a Test to New Zealand in Perth. After that loss, the hosts have played New Zealand in four Tests here and have won one and drawn three. The first Test between the two at this venue, in 1980, ended in a victory for the hosts. Australia have a 2-1 record here against New Zealand in Tests.
7-2 Win-loss record of teams batting first in the last ten Tests in Perth. India had lost to Australia after batting first in 2012 and the hosts themselves had lost to South Africa in 2008-09. Teams taking a lead of 250 or more at the end of the third innings have lost only twice in 20 matches: South Africa won chasing the second-highest target ever in Tests, in 2008 and India had lost to the hosts after setting a target of 339 in 1977. In the last ten Tests here at the WACA, teams have averaged 42.82 per wicket in the third innings, much higher than their average of 32.44, 24.65, and 32.70 in the first, second and third innings respectively. The percentage difference of 44.20 in averages between the third innings and the other three innings put together at the WACA is the highest such difference among venues to host at least five Tests since 2004.
| Venue | Tests | Ave in 3rd inns | Ave (other inns) | %age diff |
| WACA, Perth | 10 | 42.82 | 29.69 | 44.20 |
| Asgiriya Stadium, Kandy | 5 | 34.27 | 24.46 | 40.06 |
| National Stadium, Karachi | 5 | 51.77 | 38.04 | 36.07 |
| University Oval, Dunedin | 6 | 42.18 | 32.54 | 29.64 |
| Dubai International Cricket Stadium | 9 | 39.33 | 31.72 | 24.01 |
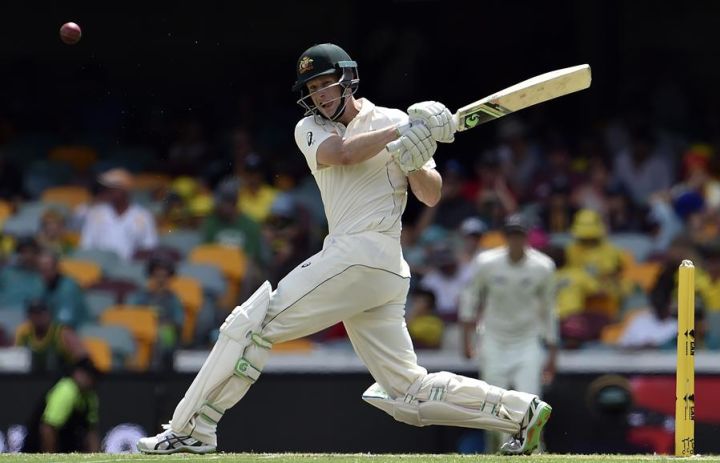
6 Australia players in the current squad who have played in Tests at the WACA before. David Warner is the leading run-scorer among them with 394 runs at an average of 78.80 with two hundreds - one of which was in the last Ashes Test here - and one fifty. Australia's captain Steven Smith too got a hundred in the last Ashes Test at this venue and has made 169 runs at 47.33.
117.33 Adam Voges' batting average in his last 15 innings at the WACA, his home ground in first-class cricket. Voges has made 1056 runs with five hundreds and three fifties in his last 15 innings at this venue, including a double-hundred against Queensland in the 2013-14 Sheffield Shield. His last five scores at this venue have been 101, 139*, 101, 22* and 83. Overall, Voges has made 3442 first-class runs at the WACA - the highest he has at any venue - at 43.02 including 12 hundreds and 11 fifties.
42 Wickets taken by Mitchell Johnson at the WACA - the most he has at any venue in Tests. His last five-wicket haul at this venue was in the 2010 Ashes Test against England when he took 6 for 38 in England's first innings. Johnson averages 20.19 at this venue and has two five-wicket hauls and one ten-wicket haul for the match. Mitchell Starc's best figures in Tests have also come at the WACA, the last and the only time he played here against South Africa. Starc took 6 for 154 in South Africa's second innings. Overall, Australia's fast bowlers in their current squad have taken 66 wickets at an average of 22.36 at the WACA.
310 Wicket taken by Johnson in Tests; he is level with Brett Lee who also took 310 Test wickets. With at least one more wicket at the WACA, Johnson will move ahead of Lee to become the fast bowler with the third-most wickets for Australia in Tests. Only Glenn McGrath (563 wickets) and Dennis Lillee (355) will be ahead of him. Johnson has taken 310 Test wickets at an average of 28.10 for Australia.
0 Number of New Zealand players who have played in Tests at the WACA before. This will be the first Test for even their captain Brendon McCullum who has played seven Tests in Australia but not one at this venue. McCullum has made 338 runs in Tests in Australia at 26.00. New Zealand's top five together have made 1037 runs in Australia at 27.28.
96.42 Kane Williamson's average in Tests this year. He has made three hundreds and two fifties in just eight innings this year. No other batsman has got at least 500 Test runs in 2015 at a better average. Among New Zealand batsman, Andrew Jones is the only one to get 500 or more Test runs in a year at a better average than Williamson's this year. Jones got 513 runs at an average of 102.60 in 1991.
7 Century stands by Australia's openers in Tests this year, the most they have had in a year. Australia's first wicket has made 1341 runs this year at an average of 78.88 - their best in any year in Tests when they have added at least 800 runs.
Shiva Jayaraman is a senior sub-editor (stats) at ESPNcricinfo.com
Read in App
Elevate your reading experience on ESPNcricinfo App.