A clash between two brittle batting line-ups
Stats preview to the three-Test series between New Zealand and West Indies, which begins in Dunedin on Tuesday
New Zealand are ranked eighth in the ICC Test rankings, lower than all teams except Bangladesh and Zimbabwe. West Indies are sixth - they have 20 points more than New Zealand, and are ranked higher than Sri Lanka as well. With more high profile series happening simultaneously, this one clearly isn't the marquee series of the cricket calendar, but it's a fine opportunity for New Zealand to get a few wins - they haven't won a Test match this year.
They were one wicket away from beating England in Auckland earlier this year, but their inability to take that wicket meant the series ended 0-0. Before that, they'd lost 0-1 to South Africa and Pakistan, and 0-2 to Australia. They've drawn Test series against Pakistan, New Zealand and West Indies, but the last time they won a series against one of the top seven sides was way back in 2006 against West Indies, when they won a three-match series 2-0. Since then, even their home record is pretty ordinary - three wins and nine defeats in 23 matches, though that's still better than their dismal away record during this period. (Click here for New Zealand's series-wise record at home against the top seven sides since 2000.)
If New Zealand's recent home record is disappointing, then West Indies' away record during the last seven years is much worse, which should give the home team some encouragement for the series. Against the other top eight sides, they've won one Test and lost 15 out of 25, with their most recent results being two thorough drubbings inside three days in India.
The overall records against the top teams are remarkably similar for the two teams in the last seven years - 5-28 in 47 Tests for New Zealand, and 6-24 in 48 for West Indies - but the fact that West Indies are playing away must make them the underdogs for this series.
| Versus | Tests | Won/lost | Bat ave | Bowl ave | 100s/ 50s |
| Top 7 teams (home) | 23 | 3/ 9 | 27.28 | 36.87 | 16/ 59 |
| Top 7 teams (away | 24 | 2/ 19 | 25.81 | 38.38 | 11/ 44 |
| Total | 47 | 5/ 28 | 26.49 | 37.58 | 27/ 103 |
| B'desh & Zim | 9 | 6/ 0 | 43.99 | 26.33 | 10/ 25 |
| Versus | Tests | Won/ lost | Bat ave | Bowl ave | 100s/ 50s |
| Top 7 teams (home) | 23 | 5/ 9 | 30.61 | 36.38 | 20/ 46 |
| Top 7 teams (away) | 25 | 1/ 15 | 28.68 | 45.32 | 19/ 55 |
| Total | 48 | 6/ 24 | 29.56 | 40.40 | 39/ 101 |
| B'desh & Zim | 8 | 5/ 2 | 38.47 | 27.30 | 11/ 16 |
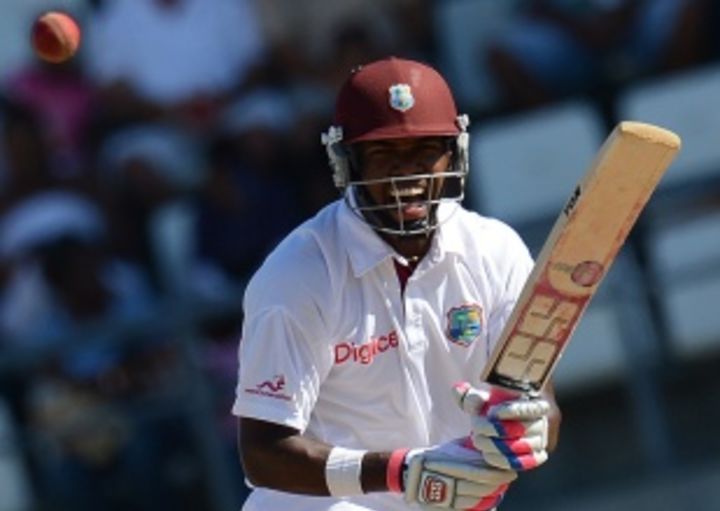
For both teams, batting is a huge concern. The line-ups are brittle, but each team has one young batsman who they hope will go on to much greater things. Darren Bravo's batting style invariably evokes comparisons with Brian Lara, while Kane Williamson - who has been ruled out of the first Test but should be back for the second - has been touted as the next big thing in New Zealand cricket for a while now. Bravo is a year-and-a-half older than Williamson, but in terms of Test experience there's little to separate the two. Both made their Test debuts within two weeks of each other, Williamson's played two more Tests, both have scored exactly four Test centuries, and both have shown a liking for Asian conditions: three of Williamson's centuries, and all four of Bravo's, have been made in Asia. Both batsmen have unusually low strike rates as well - in the 40s - but Bravo has the better average so far: 42.65, compared with Williamson's 34.78.
Bravo has the better numbers along most parameters so far: overall, in Asia, and against all teams other than Bangladesh and Zimbabwe as well. Interestingly, both batsmen have converted almost the same percentage of their total innings into 50-plus scores - 27% for Bravo and 28% for Williamson - and yet their averages differ quite significantly, by almost eight runs per dismissal. They key is the failure rate for the two batsmen - Williamson tends to get out early in his innings far more frequently. In 49 innings, he has been dismissed under ten 14 times, while 27 times he's been out before 20; the corresponding numbers for Bravo, in his 45 Test innings, are six and 15. That, essentially, explains why their averages are so different, despite a similar percentage of 50-plus scores. Bravo has made more big centuries - two of his hundreds have exceeded 160; Williamson's highest so far is 135.
Bravo, though, hasn't played much Test cricket, or had much success, outside Asia: outside of home and Asia, he's played only three Tests, in England in 2012, and his highest score in five innings was 29, and his average 16.20. Williamson has similarly struggled in Australia, South Africa and England, averaging 16.41 in 12 innings, but his average at home is a more reassuring 41.
| Tests | Runs | Average | Strike rate | 100s/ 50s | |
| Darren Bravo | 25 | 1749 | 42.65 | 46.07 | 4/ 8 |
| Kane Williamson | 27 | 1635 | 34.78 | 41.44 | 4/ 10 |
| Bravo in Asia | 12 | 1160 | 61.05 | 52.44 | 4/ 4 |
| Williamson in Asia | 9 | 739 | 46.18 | 43.06 | 3/ 4 |
| Bravo excl. B'desh, Zim | 19 | 1287 | 39.00 | 43.74 | 2/ 7 |
| Williamson excl. B'desh, Zim | 23 | 1264 | 30.82 | 39.57 | 3/ 7 |
Since these two batsmen made their Test debuts, the overall batting stats for New Zealand and West Indies looks pretty similar too. Against the top sides, New Zealand average 24.35, and West Indies only marginally better. Both teams have scored exactly 13 hundreds, and their conversion rates are equally poor.
| Tests | Average | Strike rate | 100s/ 50s | |
| West Indies | 21 | 26.65 | 46.92 | 13/ 46 |
| New Zealand | 23 | 24.35 | 46.75 | 13/ 49 |
West Indies' advantage, of course, is the presence of Shivnarine Chanderpaul in their line-up. New Zealand don't have anyone with that sort of experience or consistency. In the last three years, and against the top teams, both sides have three batsmen who've scored 1000-plus runs, but while two of the West Indian ones - Chanderpaul and Marlon Samuels - have averaged more than 45, New Zealand's three have all averaged in the 30s. Brendon McCullum and Ross Taylor, the two senior batsmen in the line-up, have both been less than prolific during this period. They'll both have to raise their games to ensure that their bowlers - who were pretty good in the last home series, against England - have enough runs to defend against Chanderpaul and Co.
| Batsman | Tests | Runs | Average | Strike rate | 100s/ 50s |
| Brendon McCullum | 23 | 1489 | 36.31 | 58.16 | 1/ 11 |
| Shivnarine Chanderpaul | 18 | 1380 | 55.20 | 41.89 | 3/ 6 |
| Ross Taylor | 21 | 1289 | 35.80 | 52.12 | 2/ 8 |
| Darren Bravo | 19 | 1287 | 39.00 | 43.74 | 2/ 7 |
| Kane Williamson | 23 | 1264 | 30.82 | 39.57 | 3/ 7 |
| Marlon Samuels | 13 | 1032 | 46.90 | 52.65 | 2/ 9 |
S Rajesh is stats editor of ESPNcricinfo. Follow him on Twitter
Read in App
Elevate your reading experience on ESPNcricinfo App.