When the numbers didn't add up
Instances when teams with the leading run-scorers and wicket-takers in a series ended up on the wrong side of the scoreline
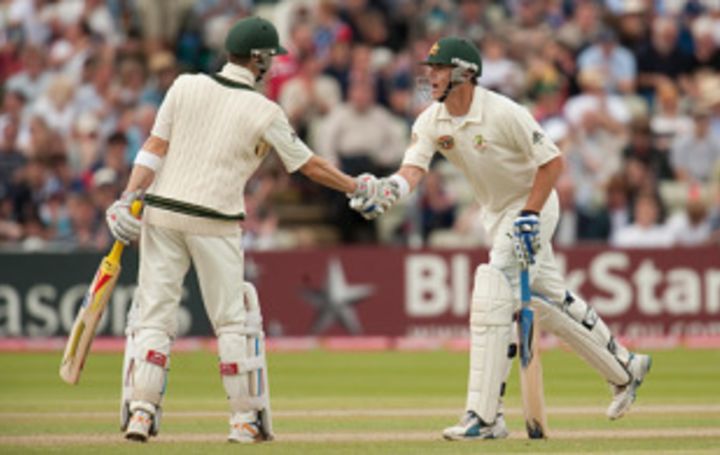
You'd expect the team with the top three wicket-takers, six of the seven highest run-scorers, and eight out of 10 centuries scored in a series to win the rubber. But Australia lost the Ashes. They lost though their best bowlers - Peter Siddle, Ben Hilfenhaus and Mitchell Johnson - took 18 more wickets between them than England's top three, though England's highest run-getters - Andrew Strauss (474) and Matt Prior (261) - were separated by six Australians, including the woefully out-of-form Michael Hussey (276), and though they had six centurions making eight hundreds to England's two. So this week we've looked at other series that have been lost by the team with the better stats.
Before the 2009 Ashes, no team had ever won a Test series after scoring six centuries fewer than their opponents. The widest gap overcame had been five, during the Frank Worrell Trophy of 1960-61. Gerry Alexander, Rohan Kanhai, Garry Sobers and Conrad Hunte hit six hundreds between them for West Indies while Australia's only century, by Norm O'Neill, came in the famous tied Test in Brisbane. Australia, however, eventually won the decider by two wickets at the MCG to take the series 2-1. The vanquished West Indians, however, had so captured the imagination of the Australian public that they were given "a send-off the like of which is normally reserved for Royalty and national heroes", according to Wisden.
| Team | 100 | Opposition | 100 | Diff | Won | Lost | Mat | Series |
|---|---|---|---|---|
| Australia | 8 | v England | 2 | 6 | 1 | 2 | 5 | 2009 |
| West Indies | 6 | v Australia | 1 | 5 | 1 | 2 | 5 | 1960/61 |
| India | 5 | v New Zealand | 1 | 4 | 0 | 1 | 2 | 1998/99 |
| Australia | 7 | v England | 4 | 3 | 0 | 1 | 5 | 1926 |
| South Africa | 6 | v England | 3 | 3 | 2 | 3 | 5 | 1955 |
| India | 7 | v England | 4 | 3 | 1 | 2 | 5 | 1984/85 |
| Pakistan | 4 | v West Indies | 1 | 3 | 0 | 1 | 3 | 1999/00 |
During India's tour of Australia in 1977-78, the visiting bowlers took seven five-wicket hauls between them - Bishan Bedi and BS Chandrasekhar took three each, while Madan Lal took one. None of the bowlers in the Packer-weakened Australian team took any - Wayne Clark's 4 for 46 was their best - but the hosts still won the closely fought five-match series 3-2, taking the fifth and deciding Test by 47 runs.
| Team | 5 | Opposition | 5 | Diff | Won | Lost | Mat | Series |
|---|---|---|---|---|
| India | 7 | v Australia | 0 | 7 | 2 | 3 | 5 | 1977/78 |
| Australia | 7 | v England | 2 | 5 | 1 | 5 | 6 | 1978/79 |
| South Africa | 5 | v England | 1 | 4 | 0 | 2 | 5 | 1948/49 |
| South Africa | 7 | v England | 3 | 4 | 2 | 3 | 5 | 1955 |
| Pakistan | 5 | v New Zealand | 1 | 4 | 0 | 1 | 3 | 1969/70 |
| Pakistan | 7 | v India | 3 | 4 | 0 | 2 | 6 | 1979/80 |
| Australia | 8 | v England | 4 | 4 | 1 | 3 | 6 | 1981 |
Had Michael Clarke scored 26 runs in the second innings at The Oval, Australia would have had both the highest run-scorer and highest wicket-taker in the Ashes. Clarke, though, was run out for a duck by Andrew Strauss, who ensured his position at the top of the runs table with a swift direct hit. The table below contains all series in which the best batsman and bowler came from the losing team.
The 1981 Ashes, which England famously won, had two Australians on top of the runs and wickets lists. Allan Border collected 533 runs in the six Tests at an average of nearly 60, Terry Alderman took 42 wickets at 21 apiece, while Dennis Lillee took 39. But Ian Botham took 34 wickets and also scored 399 runs, and his performances were powerful enough to snatch the series away from Australia.
The most recent series in the table is South Africa's tour of England in 2008. Kevin Pietersen led the run charts with 421, but he was followed by three South Africans - AB de Villiers, Graeme Smith and Neil McKenzie - before the next England batsman appeared on the list. James Anderson was the joint-highest wicket-taker along with Morne Morkel - they both had 15. South Africa won the series, taking a 2-0 lead after three Tests, but then lost the final game.
In the next table we've looked at series in which the top run-scorer finished on the losing side; it has been ordered in descending order of the difference between the highest run-scorer and the second highest. Brian Lara's effort in Sri Lanka in 2001-02 is No. 1. He was immense on that tour, scoring 688 runs (178, 40, 74, 45, 221, 130), a record aggregate in a losing cause in a three-Test series. However, there was only one West Indian in the next seven highest aggregates, and the visitors were crushed in every Test - twice by 10 wickets and once by 131 runs.
Another Lara effort, against England at home in 2003-04, is at No. 2. Lara was having a poor series, having scored only 100 runs in six innings, before he filled his boots with 400 not out in the fourth Test in Antigua. He finished with 500 runs, 204 more than England's highest run-scorer, Mark Butcher, but England had already taken the series 3-0 before Lara's record-breaking innings.
| Player | Mat | Inns | Runs | HS | Ave | 100 | 50 | Next | Diff | Series | Season |
|---|---|---|---|---|
| BC Lara (WI) | 3 | 6 | 688 | 221 | 114.66 | 3 | 1 | 403 | 285 | v Sri Lanka | 2001/02 |
| BC Lara (WI) | 4 | 7 | 500 | 400* | 83.33 | 1 | 0 | 296 | 204 | v England | 2003/04 |
| M Amarnath (India) | 5 | 9 | 598 | 117 | 66.44 | 2 | 4 | 407 | 191 | v West Indies | 1982/83 |
| Mohammad Yousuf (Pak) | 4 | 7 | 631 | 202 | 90.14 | 3 | 0 | 444 | 187 | v England | 2006 |
| GS Sobers (WI) | 5 | 8 | 709 | 226 | 101.28 | 3 | 1 | 526 | 183 | v England | 1959/60 |
| CL Walcott (WI) | 5 | 10 | 827 | 155 | 82.70 | 5 | 2 | 650 | 177 | v Australia | 1954/55 |
| L Hutton (Eng) | 5 | 10 | 533 | 156* | 88.83 | 1 | 4 | 366 | 167 | v Australia | 1950/51 |
| SM Gavaskar (India) | 4 | 7 | 542 | 221 | 77.42 | 1 | 4 | 378 | 164 | v England | 1979 |
| H Sutcliffe (Eng) | 5 | 9 | 734 | 176 | 81.55 | 4 | 2 | 573 | 161 | v Australia | 1924/25 |
| HW Taylor (SA) | 5 | 9 | 582 | 176 | 64.66 | 3 | 2 | 436 | 146 | v England | 1922/23 |
Shane Warne took 40 wickets in the 2005 Ashes, 16 more than Andrew Flintoff, who was England's highest wicket-taker, but Australia lost the series 2-1. Alderman's 42 in 1981 doesn't appear in the table because Lillee was close behind on 39. In the 1978-79 Ashes, Rodney Hogg picked up 41 wickets in six Tests - 18 more than Geoff Miller, who led the wickets list for England - but Australia were thrashed in that series 1-5.
| Player | Mat | Balls | Runs | Wkts | BBI | Ave | 5 | Next | Diff | Series | Season | |||
|---|---|---|---|---|---|---|---|---|---|---|---|---|---|---|
| RM Hogg (Aus) | 6 | 1740 | 527 | 41 | 6/74 | 12.85 | 5 | 25 | 16 | v England | 1978/79 | |||
| SK Warne (Aus) | 5 | 1517 | 797 | 40 | 6/46 | 19.92 | 3 | 24 | 16 | v England | 2005 | |||
| MW Tate (Eng) | 5 | 2528 | 881 | 38 | 6/99 | 23.18 | 5 | 24 | 14 | v Australia | 1924/25 | |||
| J Cowie (NZ) | 3 | 839 | 395 | 19 | 6/67 | 20.78 | 1 | 8 | 11 | v England | 1937 | |||
| CB Llewellyn (SA) | 3 | 796 | 448 | 25 | 6/92 | 17.92 | 4 | 15 | 10 | v Australia | 1902/03 | |||
| EAS Prasanna (India) | 4 | 1581 | 686 | 25 | 6/104 | 27.44 | 2 | 15 | 10 | v Australia | 1967/68 | |||
| RW Price (Zim) | 2 | 836 | 396 | 19 | 6/73 | 20.84 | 2 | 9 | 10 | v West Indies | 2003/04 | |||
| L Sivaramakrishnan (India) | 5 | 1647 | 723 | 23 | 6/64 | 31.43 | 3 | 14 | 9 | v England | 1984/85 | |||
| HH Streak (Zim) | 3 | 708 | 298 | 22 | 6/90 | 13.54 | 2 | 13 | 9 | v Pakistan | 1994/95 | |||
| AA Donald (SA) | 5 | 1460 | 653 | 33 | 6/88 | 19.78 | 4 | 24 | 9 | v England | 1998 |
If there's a particular List you would like to see, email us with your comments and suggestions.
George Binoy is a senior sub-editor at Cricinfo
Read in App
Elevate your reading experience on ESPNcricinfo App.