Analysing ODI careers in segments
A look at ODI batting and bowling records of players, splitting each career into three parts
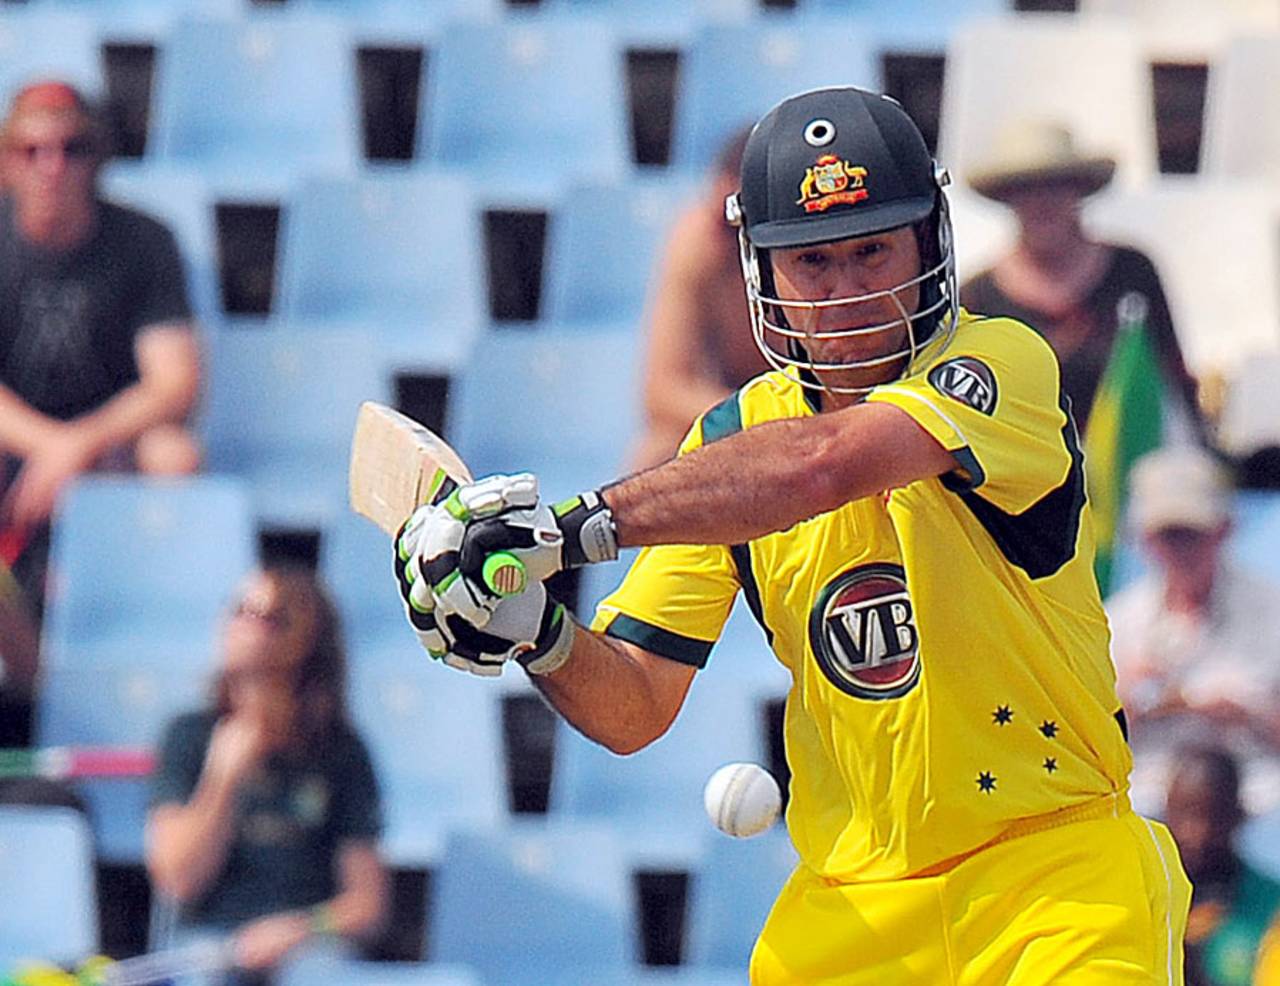
Ricky Ponting was remarkably consistent over a long ODI career • AFP
A few weeks back I had done the Test player analysis splitting the career into two equal halves. Almost the first comment that came was one from WaspSting suggesting that I analyse the career split into three equal parts instead. It was a good idea since it allows us to look at the player's settling down period, the peak period when the player is at his best and the winding down period. The insights which can be drawn can be more finely tuned towards these career-segments. I will do the Test analysis later but decided to do the ODI career analysis on this basis. It also meant that I had to integrate the 500-element match data into the player database. This will be the base for many future analysis.
The one-third positions of an ODI career. Perfect points to look back and forward. In real life, no single ODI player would have known that he was at these positions. However, looking back, with the aid of the massive database, the cut-off points are obvious, even for the currently active players. Please note that all comparisons are within the concerned player.
What is the expectation? In the initial career-segment of a player, he is younger, fitter, (possibly) faster in his actions and does not have to conserve himself. However he is inexperienced, learning the trade and susceptible to selectorial whims. In the middle career-segment, he is settled, carries the reputation built by him and this is expected to be his most productive and effective period. In the final career-segment, he is aging, has a non-syncing body and mind, has to compete with younger players and is also susceptible to selectorial decisions to blood newer players.
Who is likely to deliver? The younger, fitter but inexperienced one or the well-settled king-of-the-patch or the wily, wiser but older player. Our immediate expectation is that most players would have their best career-segment in the middle. But we may be in for surprises. Very difficult to generalize since so many other factors come into play. Let us see.
First, a few analysis criteria.
1. The career-segment is determined slightly differently to Tests and is more common-sense based. It is strictly based on the number of ODIs played. This would allow an evaluation of a player's contribution in batting and bowling together, if we so wish.
2. The overall criteria is 3000 runs for batsmen and 100 wickets for bowlers. 120 batsmen and 108 bowlers qualify. Reasonable population sizes are thus available for analysis. For current players, it is obvious that the last ODI they played could very well be their last ODI ever. If I do this analysis couple of years hence, the numbers for the current batsmen would undergo significant changes.
3. For batsmen, both Runs and RpI figures are analyzed independently. I am a strong proponent of RpI instead of Batting average, especially in ODIs. Since the average number of wickets in an innings is around 7, many of the middle order batsmen, despite the quick-scoring requirements in the later overs, have a good chance of remaining unbeaten. Let me also say, I would rather adopt a system which favours the top order batsmen than the middle and late order.
4. For batsmen, I have also included the career segment splits by Strike Rate in the data table which users can analyze on their own.
5. For bowlers, both Wickets and Bowling average figures are analyzed independently. There is expected to be less correlation between these two.
6. Users may independently analyze the career segment splits by Runs per Over and Bowls per Wicket included in the data table.
First an overall summary.
Batting
These values apply to the creme de la creme of batsmen, the 120 selected ones, who have scored 56% of the total runs scored. The average of average % of runs scored in the initial career-segment of career stands at 31.5%, nearly 9% below the 33.33% mark, indicating that the players, overall, have taken time to settle down: as expected. An alternate measure, which is the average of runs scored in the first half divided by the average of career runs, stands at an almost similar value of 31.4%. The values for the middle career-segment are 34.8% and 34.9%, indicating that this is only around 4% above the expected mark. The values for the final career-segment are 33.8% and 33.7%, indicating that this is only around 1% above the expected mark.
The average of the RpI ratio for the initial career-segment stands slightly lower at 94.3% indicating a 5% lower RpI across these batsmen. The middle career-segment has a figure of 103.9% which indicates that, during this crucial period, the batsmen have achieved about 4% more. The final career-segment period also sees a higher RpI value of 101.3%.
The average of the Batting strike rate follows a similar pattern: 96.8%, 101.7% and 101.5% for the three career-segments.
Bowling
A slightly different [picture emerges for the 108 bowlers. The three career-segments are closely bunched with values of 33.5%, 34.1% and 32.4% respectively, indicating a more even split than batting.
The bowling average variation is similar. 98%, 96% and 107% indicates a good average to start with, still better averages in the middle career-segment and a sharp drop in bowling performances in the final career-segment. The RpO values show similar trends: 99%, 99% and 103%. Only the bowling strike rate values show a slight difference: 102%, 99% and 105%. Remember that below 100 means a better performance.
Let us now look at the graphs. These have been designed specifically for this analysis. There are four graphs. Batting: Runs & RpI and Bowling: Wickets & Bowling average. Each graph shows the initial, middle and final career segment figures of 12 players. There are 3 players each for perfect splits, great start, magnificent middle and fabulous finish. Thus the graphs cover the best performers rather than the ones who have scored runs or wickets. Those players could be perused in the tables.
The first graph relates to Batting: Runs scored in each career-segment.
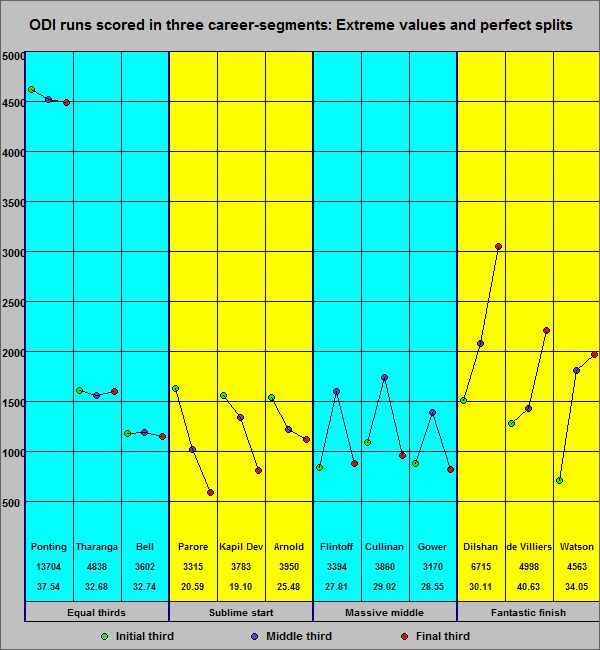 ODI runs scored by batsmen in their careers, split into three segments
© Anantha Narayanan
ODI runs scored by batsmen in their careers, split into three segments
© Anantha NarayananUsually the high performance players tend to be those who have scored fewer number of runs or captured fewer wickets. There is a nice exception here. Ponting, who has a very high career run aggregate of 13704 runs has got three career-segment values either side of 4600 with a difference of just over 100 runs. That is a wonderful level of consistency exhibited over 375 matches. Tharanga and Bell have similar even splits, however over much lower level of matches. It is of interest to note that all are modern players.
On the other hand, the three who have had the highest level of performance in the initial career-segment are batsmen who played a few years back. Parore scored 50% of his runs in the first career-segment. Kapil Dev and Arnold scored nearly 50% in the first career-segment. Then all of them dropped like stones.
The batsmen who have performed best in the middle career-segment have inverted-V shape patterns. Flintoff achieved nearly 50%, Cullinan above 50% and Gower, around 45%. But it is clear that these are not the high-scoring batsmen.
Now we come back to the fantastic finishers. The three who have finished most strongly are all currently active batsmen: Dilshan, de Villiers and Watson. While Dilshan and de Villiers have had steady upward graphs, Watson had an awful start and scored only 16% of his career runs in the first career-segment, followed by above 40% in the next two. Let us not forget that all are currently active players and these figures are bound to change.
The second graph relates to Batting: Batting average in each career-segment.
 ODI Runs per innings for batsmen in their careers, split into three segments
© Anantha Narayanan
ODI Runs per innings for batsmen in their careers, split into three segments
© Anantha NarayananPonting not only scores equally in his three career-segments, but also scores these runs at almost the same RpI value of around 37. This is a confirmation of his consistency. Bell has similar figures too. Greenidge averages either side of 41 in his three career-segments.
Parore and Kapil Dev are making their appearance again with high RpI values in the first career-segment followed by huge drops. Not so surprisingly, Pietersen joins these two and has dropped from a high RpI value of 42 to 32 recently. His recent poor ODI form is well-known.
The same, three, Flintoff, Cullinan and Gower are present in the middle graph, in the inverted-V pattern.
de Villiers and Dilshan reappear with a new entrant Virat Kohli who has moved from an RpI of around 38 in the first two career-segments to an amazing 54+ currently. Don't forget this is the RpI and not batting average.
Now for the bowlers.
The career-segment graph relates to Bowling: Wickets captured in each career-segment.
 ODI wickets taken by bowlers in their careers, split into three segments
© Anantha Narayanan
ODI wickets taken by bowlers in their careers, split into three segments
© Anantha NarayananIt is a pleasure to see Dharmasena's career-split: 46 wickets in each career-segment. It cannot get any better. Agarkar is a seriously under-rated player. He is remembered more for his unfortunate sequence of zeroes in Australia. He was a very incisive bowler in ODIs. His bowling strike rate of 33.0 places him amongst the top-20 bowlers of all time. He maintained an excellent balanced distribution of 97, 97 and 94 wickets in the three career-segments. He was a top ODI bowler irrespective of his Test credentials. Walsh was another top bowler who had a great balanced trio of career-segments with 77, 74 and 76 wickets.
Steve Waugh started like a train, capturing 98 wickets in the first career-segment. Then he accumulated only 97 wickets in the next two career-segments. One major fall it was. Abdul Razzak had a fantastic first and them a major slump with 120, 77 and 75 in the three career-segments. Styris started with 61 and then finished with 49 and 27 wickets.
Now for the inverted-V patterns. Azhar Mahmood had 34 and 26 wickets in the first and third career-segments but had a strong middle with 63 wickets. Shastri was a little more even with 42, 58 and 29 wickets. Price was similar to Shastri with 19, 44 and 37 wickets in the three career-segments.
Now the strong finishers. Umar Gul exceeded his first two career-segments of 32 and 41 wickets with a strong third at 85 wickets. Yuvraj has similar figures of 26, 26 and 60 wickets. Langeveldt also follows with 34, 17 and 49 wickets. I will leave it to the readers why the strong finishers are all current bowlers.
The fourth graph relates to Bowling: Bowling average in each career-segment.
 ODI bowling averages over a bowler's career, split into three segments
© Anantha Narayanan
ODI bowling averages over a bowler's career, split into three segments
© Anantha NarayananOne cannot but fail to be impressed with Vaas's consistency. Over a 324 match career, he has bowled at an average bowling average of around 28 right through the three career-segments. This is an acceptable average since much of Vaas's bowling had been mostly on unhelpful pitches. Cairns averaged around 34 through his career. Walsh has done so most successfully around the 31 mark. This selection is based on the Index value.
Look at Bishop's fall from the dizzying heights of 19, through 27 to a woeful 42 in the last career-segment. Must have been the impact of his injuries. Abdul Razzak started like a bomb at 21 and then went to a tailspin and averaged 33 in both his remaining career-segments. Ambrose was similar. Starting at around 19, he went to nearly 30 but then recovered to finish around 27 in the final career-segment.
Azhar Mahmood started and finished poorly at 50 and 61, but had a fantastic middle career-segment at 25. Ray Price started at around 60, recovered to a stupendous 24 and then finished respectably at 38. Muralitharan is the third bowler. He started at 28, moved to an unbelievable 18 and finished with a very good average of 26.
Mohammad Rafique started at around 50 and then improved continuously to go through 38 and finish at 30. Cronje followed a similar pattern. Wickramasinghe followed a different V pattern. He started at a high 42, went to 49 and finished very well at 33. Please remember that the selection is based on the ratios for the career-segments.
Now the Batting table, with no special comments, for the batsmen who crossed 7000 runs in their ODI career.
| Batting Analysis | Career | Run | Initial | C-S | Middle | C-S | Final | C-S | Career | RpI | Initial | C-S | Middle | C-S | Final | C-S | |
|---|---|---|---|---|---|---|---|---|---|---|---|---|---|---|---|---|---|
| Batsman | Ctry | Runs | Idx1 | Runs | % | Runs | % | Runs | % | RpI | Idx2 | RpI | Ratio | RpI | Ratio | RpI | Ratio |
| Tendulkar | Ind | 18426 | 0.075 | 5450 | 29.6% | 6565 | 35.6% | 6411 | 34.8% | 40.76 | 0.230 | 36.09 | 0.89 | 44.06 | 1.08 | 42.18 | 1.03 |
| Ponting | Aus | 13704 | 0.011 | 4641 | 33.9% | 4549 | 33.2% | 4513 | 32.9% | 37.54 | 0.036 | 37.13 | 0.99 | 38.23 | 1.02 | 37.30 | 0.99 |
| Jayasuriya | Slk | 13430 | 0.096 | 3835 | 28.6% | 5114 | 38.1% | 4481 | 33.4% | 31.01 | 0.234 | 27.39 | 0.88 | 34.55 | 1.11 | 30.90 | 1.00 |
| Inzamam | Pak | 11739 | 0.066 | 3934 | 33.5% | 4281 | 36.5% | 3524 | 30.0% | 33.54 | 0.183 | 32.51 | 0.97 | 36.59 | 1.09 | 31.46 | 0.94 |
| Kallis | Saf | 11498 | 0.047 | 3565 | 31.0% | 4092 | 35.6% | 3842 | 33.4% | 37.45 | 0.172 | 34.28 | 0.92 | 40.51 | 1.08 | 37.67 | 1.01 |
| Ganguly | Ind | 11363 | 0.082 | 3851 | 33.9% | 4193 | 36.9% | 3319 | 29.2% | 37.87 | 0.247 | 38.90 | 1.03 | 41.51 | 1.10 | 33.19 | 0.88 |
| Dravid | Ind | 10889 | 0.018 | 3673 | 33.7% | 3682 | 33.8% | 3534 | 32.5% | 34.24 | 0.086 | 34.01 | 0.99 | 35.75 | 1.04 | 33.03 | 0.96 |
| Sangakkara | Slk | 10842 | 0.166 | 2712 | 25.0% | 4017 | 37.1% | 4113 | 37.9% | 34.75 | 0.427 | 27.12 | 0.78 | 37.90 | 1.09 | 38.80 | 1.12 |
| Jayawardene | Slk | 10772 | 0.020 | 3484 | 32.3% | 3637 | 33.8% | 3651 | 33.9% | 30.08 | 0.071 | 29.03 | 0.97 | 30.82 | 1.02 | 30.42 | 1.01 |
| Lara | Win | 10405 | 0.101 | 3994 | 38.4% | 3377 | 32.5% | 3035 | 29.2% | 36.00 | 0.246 | 40.34 | 1.12 | 35.55 | 0.99 | 31.95 | 0.89 |
| Mohd Yousuf | Pak | 9720 | 0.056 | 2978 | 30.6% | 3512 | 36.1% | 3231 | 33.2% | 35.60 | 0.167 | 32.73 | 0.92 | 38.59 | 1.08 | 35.51 | 1.00 |
| Gilchrist | Aus | 9619 | 0.052 | 2969 | 30.9% | 3455 | 35.9% | 3195 | 33.2% | 34.47 | 0.177 | 31.59 | 0.92 | 37.55 | 1.09 | 34.35 | 1.00 |
| Azharuddin | Ind | 9378 | 0.064 | 2828 | 30.2% | 3244 | 34.6% | 3306 | 35.3% | 30.44 | 0.160 | 28.00 | 0.92 | 30.90 | 1.01 | 32.41 | 1.06 |
| de Silva | Slk | 9284 | 0.131 | 2737 | 29.5% | 3701 | 39.9% | 2846 | 30.7% | 31.36 | 0.342 | 27.65 | 0.88 | 36.64 | 1.17 | 29.65 | 0.95 |
| S. Anwar | Pak | 8824 | 0.127 | 2580 | 29.2% | 3503 | 39.7% | 2740 | 31.1% | 36.16 | 0.390 | 31.46 | 0.87 | 43.25 | 1.20 | 33.83 | 0.94 |
| Chanderpaul | Win | 8778 | 0.126 | 2578 | 29.4% | 2722 | 31.0% | 3480 | 39.6% | 34.97 | 0.370 | 31.06 | 0.89 | 32.40 | 0.93 | 41.43 | 1.18 |
| Haynes | Win | 8648 | 0.065 | 2731 | 31.6% | 3164 | 36.6% | 2753 | 31.8% | 36.48 | 0.221 | 34.14 | 0.94 | 40.56 | 1.11 | 34.85 | 0.96 |
| Atapattu | Slk | 8529 | 0.103 | 2656 | 31.1% | 3282 | 38.5% | 2591 | 30.4% | 32.93 | 0.244 | 30.18 | 0.92 | 36.88 | 1.12 | 31.60 | 0.96 |
| M Waugh | Aus | 8500 | 0.093 | 2439 | 28.7% | 3086 | 36.3% | 2975 | 35.0% | 36.01 | 0.262 | 31.27 | 0.87 | 38.58 | 1.07 | 38.14 | 1.06 |
| Gayle | Win | 8360 | 0.038 | 2747 | 32.9% | 2944 | 35.2% | 2670 | 31.9% | 36.50 | 0.068 | 36.14 | 0.99 | 37.74 | 1.03 | 35.60 | 0.98 |
| Sehwag | Ind | 8238 | 0.171 | 2640 | 32.0% | 2147 | 26.1% | 3451 | 41.9% | 33.90 | 0.488 | 32.59 | 0.96 | 26.84 | 0.79 | 42.09 | 1.24 |
| Gibbs | Saf | 8094 | 0.030 | 2593 | 32.0% | 2819 | 34.8% | 2682 | 33.1% | 33.72 | 0.154 | 31.24 | 0.93 | 34.38 | 1.02 | 35.76 | 1.06 |
| Yuvraj Singh | Ind | 8051 | 0.131 | 2158 | 26.8% | 2951 | 36.7% | 2942 | 36.5% | 31.94 | 0.324 | 26.64 | 0.83 | 34.72 | 1.09 | 34.21 | 1.07 |
| Fleming | Nzl | 8037 | 0.111 | 2776 | 34.5% | 2231 | 27.8% | 3030 | 37.7% | 29.87 | 0.282 | 29.85 | 1.00 | 25.64 | 0.86 | 34.04 | 1.14 |
| S Waugh | Aus | 7569 | 0.068 | 2264 | 29.9% | 2677 | 35.4% | 2628 | 34.7% | 26.28 | 0.210 | 23.58 | 0.90 | 26.50 | 1.01 | 28.88 | 1.10 |
| Ranatunga | Slk | 7456 | 0.064 | 2245 | 30.1% | 2722 | 36.5% | 2487 | 33.4% | 29.23 | 0.239 | 25.80 | 0.88 | 32.40 | 1.11 | 29.61 | 1.01 |
| J Miandad | Pak | 7381 | 0.148 | 2264 | 30.7% | 3006 | 40.7% | 2111 | 28.6% | 33.85 | 0.346 | 30.19 | 0.89 | 39.55 | 1.17 | 31.51 | 0.93 |
| S. Malik | Pak | 7170 | 0.055 | 2495 | 34.8% | 2191 | 30.6% | 2483 | 34.6% | 28.00 | 0.113 | 28.68 | 1.02 | 26.40 | 0.94 | 28.87 | 1.03 |
| Astle | Nzl | 7090 | 0.044 | 2512 | 35.4% | 2370 | 33.4% | 2208 | 31.1% | 32.67 | 0.095 | 33.49 | 1.03 | 33.38 | 1.02 | 31.10 | 0.95 |
| S Afridi | Pak | 7068 | 0.053 | 2545 | 36.0% | 2320 | 32.8% | 2203 | 31.2% | 22.01 | 0.065 | 22.72 | 1.03 | 21.48 | 0.98 | 21.81 | 0.99 |
| Clarke | Aus | 7068 | 0.125 | 2237 | 31.6% | 2033 | 28.8% | 2798 | 39.6% | 35.69 | 0.282 | 33.39 | 0.94 | 32.79 | 0.92 | 40.55 | 1.14 |
| Bevan | Aus | 6912 | 0.146 | 2468 | 35.7% | 2647 | 38.3% | 1799 | 26.0% | 35.26 | 0.254 | 35.77 | 1.01 | 38.93 | 1.10 | 30.49 | 0.86 |
| Dhoni | Ind | 6908 | 0.056 | 2114 | 30.6% | 2496 | 36.1% | 2298 | 33.3% | 36.74 | 0.174 | 33.56 | 0.91 | 39.62 | 1.08 | 37.06 | 1.01 |
| Younis Khan | Pak | 6824 | 0.061 | 2119 | 31.1% | 2485 | 36.4% | 2224 | 32.6% | 29.03 | 0.129 | 27.17 | 0.94 | 30.68 | 1.06 | 29.26 | 1.01 |
| Kirsten | Saf | 6798 | 0.104 | 2564 | 37.7% | 1913 | 28.1% | 2321 | 34.1% | 36.74 | 0.321 | 41.35 | 1.13 | 30.85 | 0.84 | 38.05 | 1.04 |
| Flower | Zim | 6786 | 0.094 | 2016 | 29.7% | 2189 | 32.3% | 2580 | 38.0% | 32.62 | 0.292 | 29.22 | 0.90 | 31.27 | 0.96 | 37.39 | 1.15 |
| Richards | Win | 6721 | 0.148 | 2598 | 38.7% | 2381 | 35.4% | 1742 | 25.9% | 40.24 | 0.391 | 43.30 | 1.08 | 44.92 | 1.12 | 32.26 | 0.80 |
| Dilshan | Slk | 6715 | 0.249 | 1540 | 22.9% | 2101 | 31.3% | 3074 | 45.8% | 30.11 | 0.579 | 21.10 | 0.70 | 30.01 | 1.00 | 38.42 | 1.28 |
Thanks to Aneesh for his reference to Richards. How can we have a table without Richards? Hence I have added a few top batsmen, including Richards, to the table.
It is necessary to explain two Index values which have been determined and have been used for selection in the graphs. The Idx1 is for the runs scored in the three career-segments. It is the sum of the absolute difference between % for each career-segment and 0.333, for the three career-segments. If the three career-segments had shares of 0.28, 0.32 and 0.40, the Idx1 value is 0.133 (0.053+0.0133+0.0667). The lower this value is, the closer the three values are to the exact third fraction. For Ponting this index value is an excellent 0.011.
The second index for RpI, Idx2, is calculated differently because of the different method of determining the impact of the values. I use a ratio between career RpI and career-segment RpI for each career-segment. Hence this index value is determined as the sum of the absolute difference between the career RpI and career-segment RpI divided by the career RpI. For Tendulkar the figure is (abs(40.76-36.09)+abs(40.76-44.06)+abs(40.76-42.18))/40.76 which works out to 0.230, indicating a fair degree of variation. For Ponting the figure is (abs(37.54-37.13)+abs(37.54-38.23)+abs(37.54-37.30))/37.54 which works out to 0.036, indicating almost no variation.
This is too big a table for me to offer a lot of comments. I will let the readers to do that. I will only do a summary.
Lara(38.4%, 32.5% and 29.2%), Sangakkara(25, 37.1 and 37.9), de Silva(29.5, 39.9 and 30.7) and Saeed Anwar(29.2, 39.7 and 31.1) have had fairly varying careers.
Tendulkar(29.6, 35.6 and 34.8), Inzamam(33.5, 36.5 and 30.0), Md. Yousuf(30.6, 36.1 and 33.2) and Gilchrist(30.0, 35.9 and 33.2) have had reasonably stable careers.
Ponting(33.9, 33.2 and 32.9), Kallis(31.0, 35.6 and 33.4), Dravid(33.7, 33.8 and 32.5), Jayawardene(32.3, 33.8 and 33.9) have had very stable careers.
Ponting's RpI values have also shown a remarkable level of consistency. Dravid and Jayawardene are fine. Look at the wide variation of RpI values for Sangakkara, Sehwag, Saeed Anwar et al.
| Bowling Analysis | Career | Wkts | Initial | C-S | Middle | C-S | Final | C-S | Career | Avge | Initial | C-S | Middle | C-S | Final | C-S | ||
|---|---|---|---|---|---|---|---|---|---|---|---|---|---|---|---|---|---|---|
| Bowler | Ctry | Type | Wkts | Idx1 | Wkts | % | Wkts | % | Wkts | % | Avge | Idx2 | Avge | Ratio | Avge | Ratio | Avge | Ratio |
| Muralitharan | Slk | rob | 534 | 0.101 | 158 | 29.6% | 205 | 38.4% | 171 | 32.0% | 23.08 | 0.58 | 28.15 | 1.22 | 17.18 | 0.74 | 25.47 | 1.10 |
| W Akram | Pak | LF | 502 | 0.062 | 158 | 31.5% | 183 | 36.5% | 161 | 32.1% | 23.53 | 0.17 | 24.03 | 1.02 | 21.66 | 0.92 | 25.17 | 1.07 |
| W Younis | Pak | RF | 416 | 0.050 | 149 | 35.8% | 138 | 33.2% | 129 | 31.0% | 23.85 | 0.28 | 20.68 | 0.87 | 25.91 | 1.09 | 25.30 | 1.06 |
| Vaas C | Slk | LFM | 400 | 0.022 | 136 | 34.0% | 135 | 33.8% | 129 | 32.2% | 27.54 | 0.05 | 27.04 | 0.98 | 27.37 | 0.99 | 28.25 | 1.03 |
| Pollock | Saf | RFM | 393 | 0.112 | 146 | 37.2% | 138 | 35.1% | 109 | 27.7% | 24.51 | 0.23 | 23.38 | 0.95 | 23.18 | 0.95 | 27.70 | 1.13 |
| McGrath | Aus | RF | 381 | 0.042 | 120 | 31.5% | 135 | 35.4% | 126 | 33.1% | 22.02 | 0.30 | 25.48 | 1.16 | 20.44 | 0.93 | 20.41 | 0.93 |
| Lee | Aus | RF | 380 | 0.060 | 138 | 36.3% | 125 | 32.9% | 117 | 30.8% | 23.36 | 0.17 | 21.49 | 0.92 | 23.90 | 1.02 | 24.98 | 1.07 |
| S Afridi | Pak | rlb | 347 | 0.252 | 72 | 20.7% | 121 | 34.9% | 154 | 44.4% | 33.52 | 0.61 | 46.93 | 1.40 | 29.83 | 0.89 | 30.14 | 0.90 |
| Kumble | Ind | rlb | 337 | 0.103 | 120 | 35.6% | 122 | 36.2% | 95 | 28.2% | 30.90 | 0.40 | 28.20 | 0.91 | 28.19 | 0.91 | 37.78 | 1.22 |
| Jayasuriya | Slk | lsp | 323 | 0.165 | 125 | 38.7% | 117 | 36.2% | 81 | 25.1% | 36.74 | 0.17 | 34.10 | 0.93 | 37.62 | 1.02 | 39.53 | 1.08 |
| Srinath | Ind | RFM | 315 | 0.044 | 112 | 35.6% | 100 | 31.7% | 103 | 32.7% | 28.08 | 0.25 | 24.79 | 0.88 | 29.76 | 1.06 | 30.03 | 1.07 |
| Warne | Aus | rlb | 293 | 0.125 | 116 | 39.6% | 92 | 31.4% | 85 | 29.0% | 25.73 | 0.47 | 20.47 | 0.80 | 29.23 | 1.14 | 29.13 | 1.13 |
| Agarkar | Ind | RFM | 288 | 0.014 | 97 | 33.7% | 97 | 33.7% | 94 | 32.6% | 27.85 | 0.16 | 30.13 | 1.08 | 25.58 | 0.92 | 27.84 | 1.00 |
| Saqlain M | Pak | rob | 288 | 0.139 | 110 | 38.2% | 102 | 35.4% | 76 | 26.4% | 21.79 | 0.51 | 19.58 | 0.90 | 19.32 | 0.89 | 28.30 | 1.30 |
| Vettori | Nzl | lsp | 282 | 0.128 | 76 | 27.0% | 98 | 34.8% | 108 | 38.3% | 31.50 | 0.52 | 40.88 | 1.30 | 28.42 | 0.90 | 27.69 | 0.88 |
| Zaheer Khan | Ind | LFM | 282 | 0.071 | 104 | 36.9% | 84 | 29.8% | 94 | 33.3% | 29.44 | 0.29 | 25.52 | 0.87 | 32.33 | 1.10 | 31.18 | 1.06 |
| Donald | Saf | RF | 272 | 0.172 | 74 | 27.2% | 114 | 41.9% | 84 | 30.9% | 21.79 | 0.47 | 26.43 | 1.21 | 17.68 | 0.81 | 23.26 | 1.07 |
| Kallis | Saf | RFM | 270 | 0.104 | 93 | 34.4% | 101 | 37.4% | 76 | 28.1% | 31.70 | 0.16 | 29.48 | 0.93 | 34.04 | 1.07 | 31.29 | 0.99 |
| A Razzaq | Pak | RFM | 269 | 0.226 | 120 | 44.6% | 77 | 28.6% | 72 | 26.8% | 31.83 | 0.53 | 25.43 | 0.80 | 35.48 | 1.11 | 38.60 | 1.21 |
| Ntini | Saf | RF | 266 | 0.108 | 81 | 30.5% | 103 | 38.7% | 82 | 30.8% | 24.67 | 0.31 | 25.30 | 1.03 | 21.30 | 0.86 | 28.27 | 1.15 |
| Harbhajan | Ind | rob | 259 | 0.106 | 100 | 38.6% | 74 | 28.6% | 85 | 32.8% | 33.40 | 0.35 | 28.29 | 0.85 | 38.97 | 1.17 | 34.55 | 1.03 |
| Kapil Dev | Ind | RFM | 253 | 0.069 | 93 | 36.8% | 82 | 32.4% | 78 | 30.8% | 27.45 | 0.16 | 25.43 | 0.93 | 28.51 | 1.04 | 28.74 | 1.05 |
| ShoaibAkhtar | Pak | RF | 247 | 0.092 | 92 | 37.2% | 84 | 34.0% | 71 | 28.7% | 24.98 | 0.49 | 20.77 | 0.83 | 23.75 | 0.95 | 31.89 | 1.28 |
| Streak | Zim | RFM | 239 | 0.045 | 76 | 31.8% | 78 | 32.6% | 85 | 35.6% | 29.83 | 0.13 | 31.20 | 1.05 | 30.42 | 1.02 | 28.06 | 0.94 |
| Gough | Eng | RF | 235 | 0.096 | 86 | 36.6% | 82 | 34.9% | 67 | 28.5% | 26.44 | 0.29 | 24.20 | 0.92 | 25.28 | 0.96 | 30.73 | 1.16 |
| Walsh | Win | RF | 227 | 0.015 | 77 | 33.9% | 74 | 32.6% | 76 | 33.5% | 30.47 | 0.05 | 30.43 | 1.00 | 31.30 | 1.03 | 29.71 | 0.98 |
| Ambrose | Win | RF | 225 | 0.204 | 98 | 43.6% | 62 | 27.6% | 65 | 28.9% | 24.13 | 0.51 | 19.30 | 0.80 | 29.15 | 1.21 | 26.63 | 1.10 |
| Anderson | Eng | RFM | 216 | 0.287 | 75 | 34.7% | 41 | 19.0% | 100 | 46.3% | 30.57 | 0.33 | 25.28 | 0.83 | 32.15 | 1.05 | 33.89 | 1.11 |
| Mills | Nzl | RM | 205 | 0.153 | 56 | 27.3% | 84 | 41.0% | 65 | 31.7% | 26.00 | 0.43 | 31.34 | 1.21 | 21.49 | 0.83 | 27.22 | 1.05 |
| McDermott | Aus | RF | 203 | 0.076 | 60 | 29.6% | 75 | 36.9% | 68 | 33.5% | 24.72 | 0.49 | 31.35 | 1.27 | 21.20 | 0.86 | 22.75 | 0.92 |
| Harris | Nzl | RM | 203 | 0.184 | 86 | 42.4% | 68 | 33.5% | 49 | 24.1% | 37.50 | 0.41 | 31.49 | 0.84 | 40.62 | 1.08 | 43.73 | 1.17 |
| Cairns | Nzl | RFM | 201 | 0.119 | 62 | 30.8% | 79 | 39.3% | 60 | 29.9% | 32.81 | 0.05 | 33.48 | 1.02 | 32.95 | 1.00 | 31.92 | 0.97 |
| Malinga | Slk | RFM | 200 | 0.123 | 62 | 31.0% | 59 | 29.5% | 79 | 39.5% | 26.58 | 0.19 | 24.08 | 0.91 | 29.07 | 1.09 | 26.67 | 1.00 |
The two index values are calculated similar to batting.
We have already seen how consistently Vaas has performed. McGrath has also been very consistent right through. 120, 135 and 126 wickets represent a very even set of career-segments. Wasim Akram and Waqar Younis have also been quite consistent. Look at how much of a variation there is for Shahid Afridi: 72, 121 and 154 wickets.Warne has also been fairly inconsistent.
We have already seen Muralitharan's inverted-V pattern exhibiting widely varying bowling average. Wasim Akram and Brett Lee have pretty good distribution. All the other top bowlers exhibit a fair degree of variation, especially Shahid Afridi and Warne.
The overall RpO index values are 0.99, 0.99 and 1.03, indicating that the third career-segment has been slightly more difficult for the bowlers. Vaas's consistency on bowling accuracy is remarkable. Muralitharan is way off and the other top bowlers have done quite well. This is probably the most stable amongst all measures across the career. Barring Murali, Warne and Kumble, most of the other top bowlers all have index values below 0.1.
The overall values are 1.02, 0.99 and 1.05, again indicating a more difficult third career-segment and an excellent middle career-segment. Surprisingly Shahid Afridi who has an excellent distribution in the RpO values, viz., 4.74, 4.52 and 4.57, varies like a yo-yo in the BpW values, viz., 44, 60 and 40.
To download/view the Excel sheet containing the ODI Players career analysis tables, please click/right-click here.
I think I have had enough of these career level analyses. Let me look at something totally different now. The next is on Wicket-keepers and then the best-10-year analysis for Test players: this may look like a career-level analysis but will need a totally different perspective.
A footnote. We do many comparisons across ages, formats, player types, playing conditions, game rules etc. We do not always have a clear set of comparing norms identified. Many of these are subjective and are personal opinions. In a way it is similar to the question which is raised after each Olympics. Who is the greatest Olympian of all times?
- Is it Usain Bolt with an unprecedented treble in two consecutive Olympics?
- Is it Michael Phelps who has captured 22 medals in 3 Olympics, 18 of which were gold?
- Is it Carl Lewis who captured 10 medals, including 9 gold, spread across 4 Olympics?
- Is it Paavo Nurmi who has captured 12 medals in three Olympics, 9 of which were gold?
not to say anything of
- Lasse Viren who did the 5000/10000 meters double in two consecutive Olympics, Blankers-Coen who won 4 gold medals in London, Jesse Owens who won 4 gold medals in a totally hostile situation in Berlin, Daley Thomson and Bob Mathias who won Decathlon in 2 consecutive Olympics, Steven Redgrave who won 5 gold and 1 bronze medals in 5 Olympics and Al Oerter who captured gold in the same event in 4 consecutive Olympics.
The bottom-line is that there is no single simple answer to any of these questions.