Duckworth-Lewis and its worthy challenger
The D/L method has done a fair job of setting targets in reduced limited-overs matches, but there's another system that deserves a fair trial
S Rajesh
14-May-2011
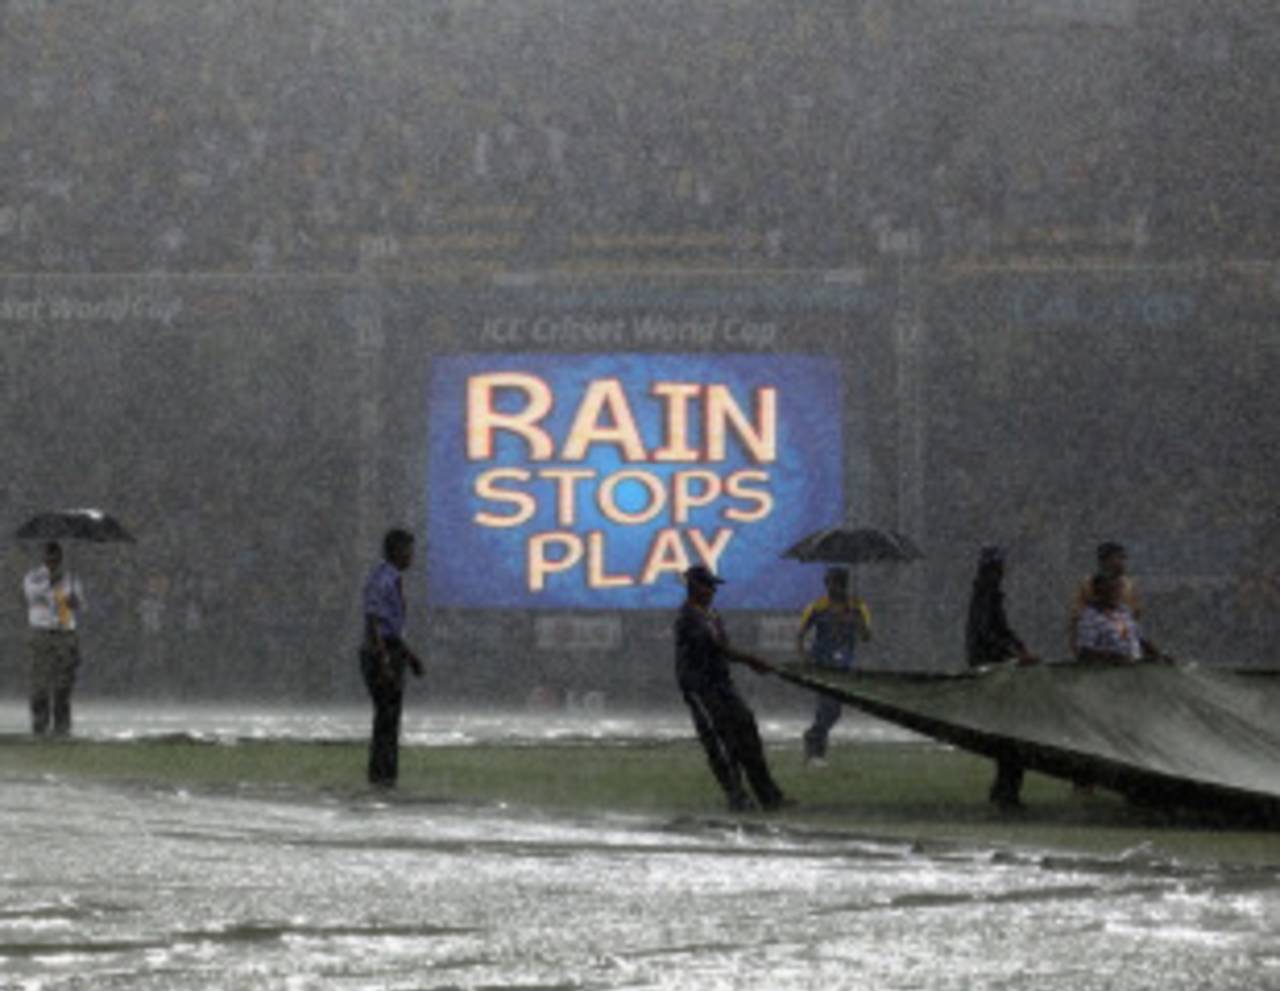
Had this World Cup game between Sri Lanka and Australia resumed for a 30-over contest, the target by the Jayadevan method would have been 14 runs fewer than the D/L target • Getty Images
The 2011 World Cup was largely free of weather interruptions, but one of the two games affected by rain was a much-anticipated one, between Sri Lanka and Australia in Colombo. It was fairly even when the match was called off: Sri Lanka, after choosing to bat, were 146 for 3 in 32.5 overs, going at a run-rate of 4.44. Considering the pitch was offering turn and bounce, Sri Lanka were arguably ahead on points at that stage. Not a ball was bowled after that, but imagine for a moment that the rains eased up later, allowing two more hours of play - Sri Lanka's innings would have been curtailed at the point of interruption and Australia would have got 30 overs in which to chase a revised target. An upward revision is clearly needed since it's assumed that Sri Lanka paced their innings expecting it to last 50 overs - the only question is, to what extent should the target be scaled up?
According to the Duckworth-Lewis method, the system that's currently used in all internationals to set revised targets in curtailed matches, Australia would have needed to score 199 to win in 30 overs - an asking rate of 6.63 runs per over, almost 50% more than Sri Lanka's run rate at the time of the interruption. Is it a fair revised target, or is it too much compensation for the overs lost? An alternative to the D/L method, which has been adopted in Indian domestic cricket, is the V Jayadevan system, devised by an engineer from Kerala. According to this method, Australia's target would have been 185, which is a required run rate of 6.17. The difference between the two targets is 14 runs, which is significant in a 30-over innings. It's debatable as to which is the fairer target, but the VJD method has shown itself to be an alternative that deserves close scrutiny. The detailed explanations of the methods are far too complex for the scope of this article (and its writer), but what can be done is to test the two methods on various parameters - some common and others not so common - and to check how each method responds to different scenarios, both real and imaginary.
Scaling of targets
Change the totals, keeping the overs and wickets lost constant, and see how the two methods respond. This experiment also brings out one of the differences between the two methods: the D/L system clubs the targets together quite closely even when the range of scores by the first team is quite wide.
Change the totals, keeping the overs and wickets lost constant, and see how the two methods respond. This experiment also brings out one of the differences between the two methods: the D/L system clubs the targets together quite closely even when the range of scores by the first team is quite wide.
Examine the table below: in the two scenarios when the team batting first score 60 without loss and 100 without loss in 20, the difference in the targets for the team chasing is only 11; it's only 27 between team A's scores of 60 and 130. There's clearly an argument to suggest that the targets can't be so close together when in one scenario a team scores at three runs per over, and in another it scores at 6.50.
On the other hand, Jayadevan's targets seem to have a better spread, with the difference between the ones for 60 and 100 being 44, and that between 60 and 130 being 73. The difference between the actual runs scored and the difference in targets is fairly similar. The question, though, is this: is 194 in 20 - 9.70 runs per over - a fair target for the second team after the team batting first have scored 130 without loss; i.e., an increase of 64 runs to the target in 20 overs?
| Scenario | D/L target | VJD target |
| Team A 60 for 0 in 20, innings terminated. Target for team B in 20 | 147 | 121 |
| Team A 100 for 0 in 20, innings terminated. Target for team B in 20 | 158 | 165 |
| Team A 130 for 0 in 20, innings terminated. Target for team B in 20 | 174 | 194 |
The internal consistency issue
Imagine the following scenario: Team A are 110 for 5 in 30 overs when their innings is terminated. According to D/L, Team B's target in 30 will be 152, an increment of 42 runs (as against VJD's 134). If the match is then further reduced to 20 overs, the D/L target becomes 108, as against VJD's 105.
Imagine the following scenario: Team A are 110 for 5 in 30 overs when their innings is terminated. According to D/L, Team B's target in 30 will be 152, an increment of 42 runs (as against VJD's 134). If the match is then further reduced to 20 overs, the D/L target becomes 108, as against VJD's 105.
Now suppose the match had started with each team getting 30 overs, and Team A had scored 151 (which is the same as the scenario above in which team B has a target of 152 in 30). If team B get 20 overs in their chase, their target changes to 117, which is nine runs more than in the case mentioned above. However, the VJD method maintains its consistency: if Team A scores 133 in 30 (so that the target becomes 134, which is same as the example above), the target for Team B remains 105. There are instances when the difference in the D/L target is about 10 runs; in the VJD method, on the other hand, the difference is never more than a run.
The Twenty20 question
The D/L method has come in for criticism especially for its handling of situations in Twenty20 games. Paul Collingwood was vocal in his criticism after England were beaten by West Indies in successive World Twenty20s, while Stephen Fleming hit out against the method after Chennai's defeat to Kochi in the IPL. Let's look at these cases and compare with the VJD method:
The D/L method has come in for criticism especially for its handling of situations in Twenty20 games. Paul Collingwood was vocal in his criticism after England were beaten by West Indies in successive World Twenty20s, while Stephen Fleming hit out against the method after Chennai's defeat to Kochi in the IPL. Let's look at these cases and compare with the VJD method:
Chennai v Kochi, IPL
Chennai were 65 for 2 in nine overs when rain reduced the game to 17 overs per team. Chennai finished with 131, and Kochi's target was increased by only three runs, i.e. to 135. The VJD method wouldn't have helped Fleming either - the target by that method is also exactly the same. One of the reasons why the revised target wasn't higher was because the three overs lost were in the middle of Chennai's innings, and they got eight overs after the interruption to resurrect their innings. Had the rain intervened at the end of the innings, Kochi's target would have been 141 according to D/L, and 142 according to VJD.
Chennai were 65 for 2 in nine overs when rain reduced the game to 17 overs per team. Chennai finished with 131, and Kochi's target was increased by only three runs, i.e. to 135. The VJD method wouldn't have helped Fleming either - the target by that method is also exactly the same. One of the reasons why the revised target wasn't higher was because the three overs lost were in the middle of Chennai's innings, and they got eight overs after the interruption to resurrect their innings. Had the rain intervened at the end of the innings, Kochi's target would have been 141 according to D/L, and 142 according to VJD.
England v West Indies, World Twenty20, 2010
England's score of 191 in 20 turned out to be a losing one after D/L decided that West Indies' revised target in six overs was 60. (They were 30 without loss in 2.2 overs, 11 ahead of the par score, at the time of the interruption.) VJD's method would have given a revised target of 62, which wouldn't have helped England's cause much.
England's score of 191 in 20 turned out to be a losing one after D/L decided that West Indies' revised target in six overs was 60. (They were 30 without loss in 2.2 overs, 11 ahead of the par score, at the time of the interruption.) VJD's method would have given a revised target of 62, which wouldn't have helped England's cause much.
England v West Indies, World Twenty20, 2009
This time England scored 161, and West Indies got only nine overs in their innings, with their revised target being 80. According to the new D/L calculations, the target would have been 84; according to VJD, it's 85, so there's little to choose again.
This time England scored 161, and West Indies got only nine overs in their innings, with their revised target being 80. According to the new D/L calculations, the target would have been 84; according to VJD, it's 85, so there's little to choose again.
Overall, the Twenty20 calculations suffer because of lack of matches - an issue that will be resolved as more matches are added to the database - and by the need to have a complete match for as few as five overs. A sensible solution would be to insist on at least 10 overs per side for a valid game.
As it stands, though, D/L's outputs are sometimes sticky, and not as dynamic as they should be for a short format. Check the rows in pairs in the table below, and it throws up some interesting numbers: the D/L target changes by just one run even though the score of the team batting first changes by nine; for a 15-run increase, the D/L target goes up by just four; and the target goes down by just one run when the team batting first scores 50 in eight overs instead of seven.
| Scenario | D/L target | VJD target |
| Team A 41 for 0 in 7 overs. Target for team B in 7 | 64 | 59 |
| Team A 50 for 0 in 7 overs. Target for team B in 7 | 65 | 67 |
| Team A 35 for 0 in 6 overs. Target for team B in 6 | 56 | 51 |
| Team A 50 for 0 in 6 overs. Target for team B in 6 | 60 | 65 |
| Team A 50 for 0 in 7 overs. Target for team B in 7 | 65 | 67 |
| Team A 50 for 0 in 8 overs. Target for team B in 7 | 64 | 61 |
More examples
A few more scenarios from actual ODIs, which highlight the differences between the two methods:
A few more scenarios from actual ODIs, which highlight the differences between the two methods:
New Zealand batted first, and were 81 for 5 in 27.2 overs when rain reduced the game to 49 overs per side. Then, with New Zealand on 114 for 5 in 32.4, their innings was called off, and the second innings was truncated to 32 overs. South Africa's target, according to the D/L charts at the time, was 153, but according to their latest version, the target would have been 156; the VJD target is 136, which is 20 runs fewer than the D/L requirement.
At the time of the interruption, New Zealand's run rate was 3.48 runs per over, with five wickets down and 17.2 overs to spare. According to D/L's latest calculations, South Africa's required run rate would be 4.87; the VJD required rate would be 4.25.
New Zealand made 212 for 5 in 44.2 when their innings was curtailed, and West Indies' response was truncated to 33 overs. D/L calculated their revised target at the time as 212, while according to today's D/L tables, it's 210. VJD pegs their 33-over target at 197.
Again, a comparison of run rates raises a few questions. New Zealand's run rate at the end of their innings was 4.78; West Indies' required rate in 33 overs according to D/L is 6.36, an increase of 33%. VJD's required rate is 5.97, an increase of 25%.
Replying to South Africa's imposing 306 for 6 in 50 overs, New Zealand, riding on Stephen Fleming's outstanding century, were 182 for 1 in 30.2 when rain reduced the chase to 39 overs. According to the new D/L calculations, the revised target would have been 229 (it was 226 at the time). According to VJD, the new target is 241.
The point of contention is this: at the time of the interruption, New Zealand's required rate was 6.35 runs per over, stretching over a period of almost 20 overs. Going by the current D/L calculations, the required run rate on resumption is 5.42, over a period of just 8.4 overs - obviously, the rain has simplified New Zealand's task enormously (though the D/L contention is that New Zealand are reaping the rewards of being well ahead of the par score at the point of interruption). The VJD method pegs the required rate at 6.80, which is at least marginally higher than the requirement at the time of the interruption.
In the first two examples, there is an argument that the target for the chasing team is beefed up far too much, based on the assumption that the team batting first would have scored lots of runs in the last few overs, had they been allowed to bat through. In the third example, there is surely a case to argue that the chasing team's target has been over-simplified after the interruption, as the overs left and the required rate both drop significantly.
Over the last decade, both methods have undergone tweaks, and have evolved into systems that need a computer to perform the complex calculations. The ICC has backed the D/L method, and over the last decade its results have been largely satisfactory. However, they need to keep their eyes open to better options. There isn't conclusive proof yet that Jayadevan's system is a better one, but in most situations its results have been fair, and it has been adopted by the BCCI for India's domestic limited-over games. It now deserves a fair trial at the international level, and a chance to prove it is or isn't good enough.
S Rajesh is stats editor of ESPNcricinfo