Run-drought for Gambhir and Ponting, and Lara v Bravo
Both Ponting and Gambhir average less than 30 in their last 25 Test innings. Plus: the uncanny similarities between two West Indies two left-handers
S Rajesh
Nov 18, 2011, 3:05 AM
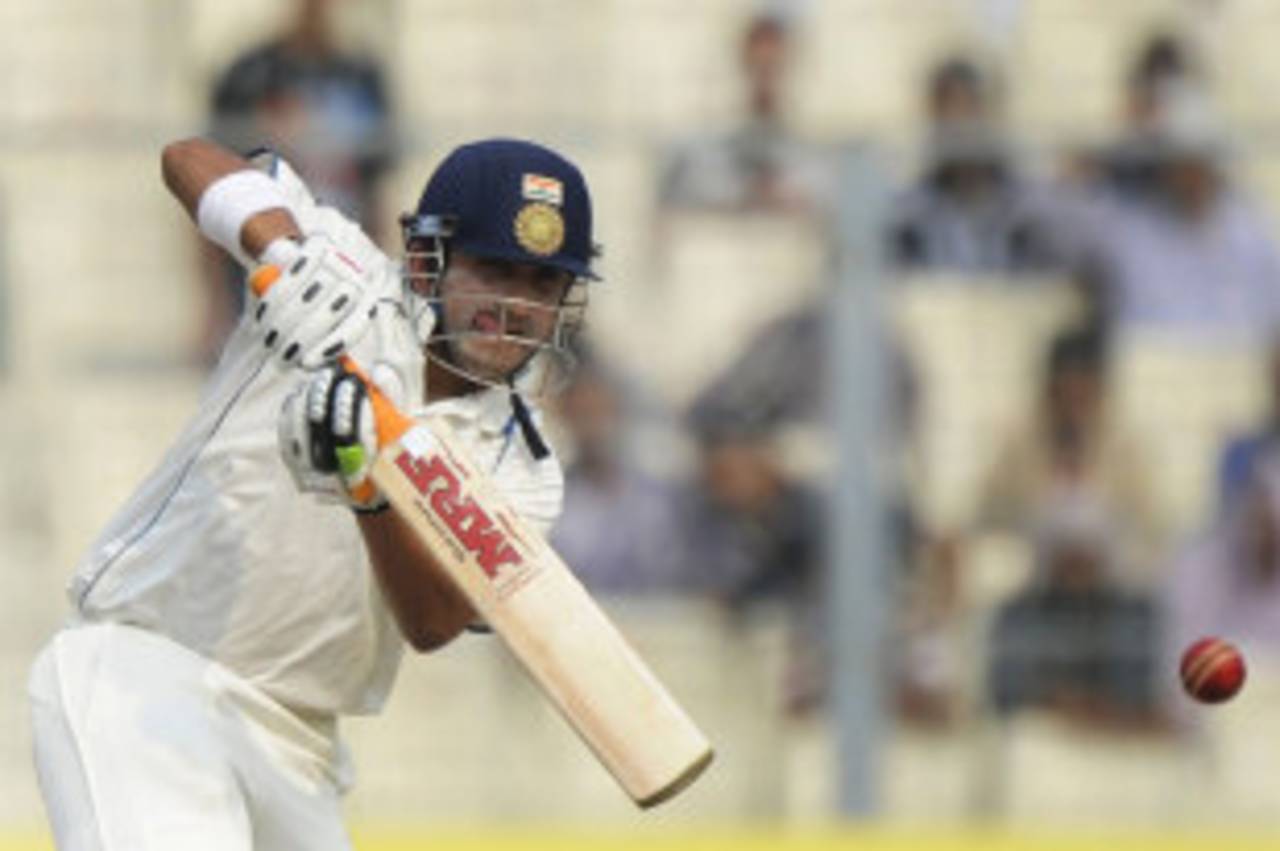
Gautam Gambhir averages 29.33 in his last 25 innings, with six fifties but no hundred • AFP
The career stats of Ricky Ponting and Gautam Gambhir can't be compared at the moment - one is a legend, having scored more than 12,000 Test runs at nearly 53, while the other is still climbing the rungs of batsmanship and hasn't yet reached 3500 Test runs. Yet, over the last 22 months, they've both gone through a poor run, posting numbers that look very similar: both have played exactly 25 innings, haven't scored a century, and averaged less than 30.
Obviously the spotlight has been much more on Ponting than on Gambhir, who has escaped almost any attention during this period. Ponting has had a far more successful career so far, with runs in almost all sorts of conditions against different types of bowling attacks over an extended period of time. Moreover, the highs he had were quite spectacular: during the eight-year period between 1999 and 2006, Ponting scored 8114 runs at 65.43, easily the best among all batsmen during that period, which also mean his lows will come under greater scrutiny too.
A couple of other factors come in too: Ponting's slump has been much longer. Since the beginning of 2007, no batsman with 3000 runs has a lower average, which indicates just how low his stocks have fallen. Also, Gambhir has managed to deflect attention also because of his fabulous ODI record during this period: in 23 matches, he has scored two centuries and eight fifties, and averages 56.90 at a strike rate of 91.77. Ponting's is pretty good too, but nowhere near Gambhir's - average of 40, and strike rate of 84 in 34 innings. Moreover, in the previous two years below this recent slump, Gambhir had scored eight hundreds in 29 innings, and averaged 76.59.
The last 22 months, though, have been forgettable for both in Tests. Gambhir was a touch unlucky in England with injuries, and India's plight on that tour meant he was forced to bat despite not being in a condition to do so. However, that's only one out of the seven series he has played during this period. Ponting has played six series (including the ongoing one in South Africa), and apart from the tour to India in 2010-11, has averaged less than 32 in each.
| Batsman | Tests | Innings | Runs | Average | 100s/ 50s |
| Ricky Ponting | 13 | 25 | 636 | 26.50 | 0/ 5 |
| Gautam Gambhir | 14 | 25 | 704 | 29.33 | 0/ 6 |
At their respective positions, both Gambhir and Ponting have been among the poorest performers. Gambhir's average as an opener during this period has been 31.85 - among openers who've batted at least 15 innings during this period, only Bangladesh's Imrul Kayes and Phil Hughes of Australia have poorer averages. Despite Gambhir's lean patch, though, he's still managed to put together reasonable partnerships with Virender Sehwag: in 21 innings they average 49.50, with ten partnerships of 50 or more. The reasonable partnerships that they've put together is another reason why Gambhir's relative failures during this period have largely gone unnoticed. (Click here for the full list of openers during this period.)
| Batsman | Tests | Innings | Runs | Average | 100s/ 50s |
| Imrul Kayes | 8 | 16 | 359 | 22.43 | 0/ 1 |
| Phil Hughes | 8 | 15 | 423 | 30.21 | 1/ 1 |
| Gautam Gambhir | 13 | 22 | 669 | 31.85 | 0/ 6 |
| Alviro Petersen | 9 | 17 | 572 | 33.64 | 1/ 3 |
| Mohammad Hafeez | 10 | 20 | 573 | 33.70 | 1/ 3 |
| Andrew Strauss | 18 | 27 | 904 | 34.76 | 1/ 7 |
Ponting's numbers look even worse, compared to the other No.3s during this period. His average of 26.28 compares very poorly with the rest in the table below: the next-lowest average is a highly respectable 42.66, by Pakistan's Azhar Ali.
| Batsman | Tests | Innings | Runs | Average | 100s/ 50s |
| Ricky Ponting | 12 | 22 | 552 | 26.28 | 0/ 5 |
| Azhar Ali | 14 | 27 | 1024 | 42.66 | 1/ 10 |
| Rahul Dravid | 18 | 30 | 1245 | 44.46 | 5/ 3 |
| Jonathan Trott | 16 | 24 | 1291 | 64.55 | 4/ 5 |
| Kumar Sangakkara | 14 | 25 | 1606 | 69.82 | 6/ 6 |
| Hashim Amla | 11 | 18 | 1177 | 78.46 | 6/ 2 |
Bravo v Lara
The similarities in batting style had been written about long before Darren Bravo made his international debut - the batting stance of both Lara and Bravo, their trigger movements, their flourish with they drive the ball, are all uncannily similar. Now, after 12 Test matches, it turns out that the number of runs they've scored, and their averages, are also exactly the same - 941 runs at 47.05. Bravo has played two more innings, but has also been unbeaten twice, to Lara's none. Both also have eight fifty-plus scores, though the split of hundreds to fifties is slightly different.
The one major difference in the numbers is the balls faced, and hence their strike rates. Lara's is 62; Bravo's is 47.14. In terms of balls faced, Bravo has played 479 more deliveries to score the same number of runs as Lara had after 12 Tests. Both have almost the same number of boundary runs too - Lara has the edge by four runs - though their boundary methods are quite different: Lara had struck only three sixes at that stage of his career, while Bravo already has 17. Another difference is the kind of opposition, and the kind of conditions, that they have encountered in their first 12 Tests: Bravo has played at home and in the subcontinent, while Lara had a full five-Test series in Australia, where he flourished, scoring his first hundred - a glorious 277, no less - and three fifties.
| Innings | Runs | Average | Balls faced | Strike rate | 100s/ 50s | 4s/ 6s | Boundary runs | |
| Brian Lara | 20 | 941 | 47.05 | 1517 | 62.03 | 1/ 7 | 119/ 3 | 494 |
| Darren Bravo | 22 | 941 | 47.05 | 1996 | 47.14 | 2/ 6 | 97/ 17 | 490 |
Their ODI numbers aren't that dissimilar either. Bravo's played 31 so far, and averages 31.54 at a strike rate of almost 73; Lara's average after 31 was slightly higher, but his strike rate was only 67.18. By the time his career ended, Lara had pushed it up to 79.51, at an average of 40.48. More importantly, Lara maintained these numbers over 299 ODIs, and an international career that straddled more than 16 years. If Bravo's career stretches as long, West Indies cricket, and indeed world cricket, will be well served.
| Innings | Runs | Average | Strike rate | 100s/ 50s | |
| Brian Lara | 31 | 991 | 34.17 | 67.18 | 0/ 9 |
| Darren Bravo | 28 | 757 | 31.54 | 72.71 | 0/ 5 |
S Rajesh is stats editor of ESPNcricinfo. Follow him on Twitter