Outstanding in ODIs, mediocre in Tests
Martin Guptill makes big hundreds for fun in ODIs, but in Tests he has struggled to make an impact despite having played almost 50 matches
S Rajesh
03-Mar-2017
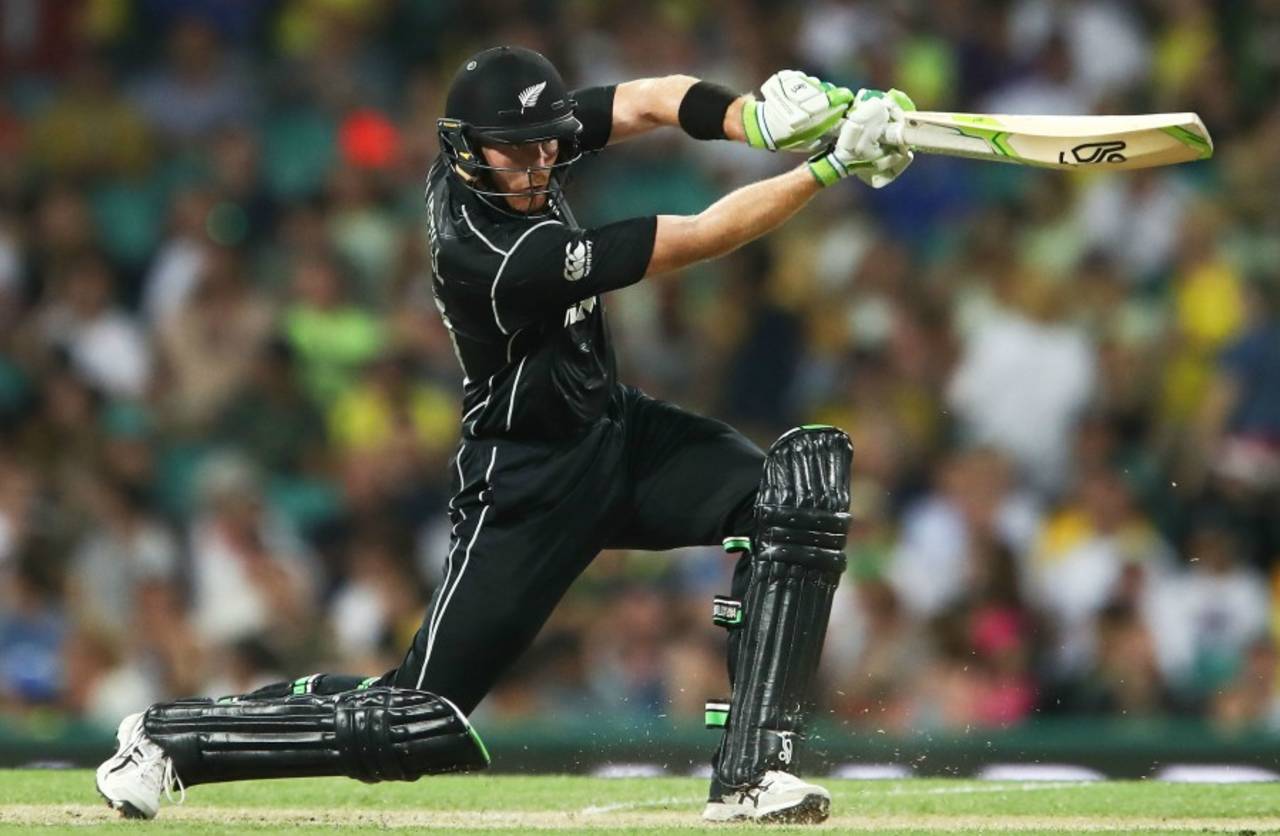
Guptill's stats versus Josh Hazlewood in the two formats sums up his international career: 32 runs, four dismissals in 119 balls in Tests; 92 runs, no dismissals in 97 balls in ODIs • Getty Images
In the fourth ODI against South Africa, Martin Guptill proved once again - if further proof was required - what a champion he is in the 50-over format. His unbeaten 180 in the Hamilton win is the fourth-highest score in an ODI chase, and the third highest in all ODIs for New Zealand - the top two also stand in his name. He is third among New Zealand batsmen with most ODI hundreds (12), and his average of 43.98 is third among 58 New Zealand batsmen with 500 or more ODI runs - only Glenn Turner and Kane Williamson have higher averages.
In Tests the Guptill story is entirely different: it is dominated by a string of low scores, and an inability to convert starts. In his last 30 Test innings, he has gone past 20 on 14 occasions, but only two of those innings were higher than 75, and one over 100; eight times he was dismissed between 21 and 49.
Guptill's overall career numbers amply demonstrate this dichotomy: his ODI career average is in the mid-40s, and he has been particularly resplendent in this format in the last couple of years, while his Test average continues to languish in the late 20s, with no real sign of a revival.
| Tests | ODIs | |||||||
| Period | Inngs | Runs | Ave | SR | Inngs | Runs | Ave | SR |
| Till Dec 2014 | 59 | 1718 | 29.62 | 43.40 | 87 | 2953 | 37.85 | 80.20 |
| Jan 2015 onwards | 30 | 868 | 28.93 | 54.59 | 52 | 2457 | 54.60 | 99.03 |
| Career | 89 | 2586 | 29.38 | 46.61 | 139 | 5410 | 43.98 | 87.78 |
While there have been players who have done better in ODIs than in Tests in the past, it is quite unusual for a batsman to average so much more in ODIs compared to Tests, despite getting ample opportunities in each format. The difference between Guptill's ODI and Test averages is 14.60; among all batsmen who have scored 2500-plus runs in each format, none have a higher difference. The next highest is 12.87, for MS Dhoni, but Dhoni's ODI average is skewed by not-outs: he was unbeaten in 67 out of 249 innings.
Among top-order batsmen Jonathan Trott is next, with a difference of 7.17, which is less than half the difference that Guptill has had in his career so far. Trott, though, was an accomplished Test batsman with a healthy average of 44.08; in ODIs his average was an exceptional 51.25, though his strike rate was a middling 77. Guptill has managed a high ODI average at a strike rate of very nearly a run a ball. Graeme Hick and Shane Watson, two other batsmen who never quite cracked the Test code, are also in this list. With a slightly lower cut-off, the batsman whose averages most resemble Guptill's is the South African Boeta Dippenaar: he averaged 42.23 in ODIs (though at a much lower strike rate than Guptill), but only 30.14 in Tests, over 62 innings.
When limiting the members to openers alone, the difference between Guptill and the others is even more stark. For a start, Guptill has done better as opener in ODIs and worse in Tests, in comparison to his overall career numbers in each format. The difference in averages - which is 14.60 over his entire career - increases to nearly 19 when his stats as opener are considered. The next highest is about one-third that number - Geoff Marsh's 6.41, followed by Watson's 4.16 (with a minimum qualification of 2000 runs as opener in each format). Clearly Guptill has been as much a success in ODIs as he has been a failure in Tests.
| Batsman | Test runs | Ave | ODI runs | Ave | Diff |
| Martin Guptill | 2062 | 27.49 | 4785 | 46.46 | 18.96 |
| Geoff Marsh | 2819 | 33.56 | 4357 | 39.97 | 6.41 |
| Shane Watson | 2049 | 40.98 | 3882 | 45.14 | 4.16 |
| Grant Flower | 2373 | 29.30 | 4409 | 33.15 | 3.85 |
| Tillakaratne Dilshan | 2170 | 42.55 | 7367 | 46.04 | 3.49 |
| Roshan Mahanama | 2069 | 29.14 | 3283 | 30.97 | 1.83 |
On current form, Guptill is undoubtedly one of the best ODI batsmen going around, with an average of 54.60 and a strike rate of 99.03. Multiplying the average by the runs per ball gives him a batting score of 54.07, which is third among batsmen who have made 1500-plus runs. The top five batsmen on this list are clearly the heavyweights in the format today.
In Tests, though, he languishes at the bottom of the pile, with the lowest average among the 81 openers who have scored 2000-plus runs. Among the 218 top-order batsmen (Nos. 1-7) who have scored 2500-plus Test runs, only six have a lower average, of whom three are wicketkeepers; the others are Mohammad Ashraful, Alistair Campbell, and Roshan Mahanama.
| Player | Inns | Runs | Average | SR | 100s | Ave x SR/100 |
| AB de Villiers | 37 | 1942 | 69.35 | 119.50 | 6 | 82.87 |
| David Warner | 42 | 2407 | 61.71 | 107.88 | 11 | 66.57 |
| Martin Guptill | 52 | 2457 | 54.60 | 99.03 | 7 | 54.07 |
| Faf du Plessis | 42 | 2000 | 57.14 | 89.92 | 5 | 51.38 |
| Virat Kohli | 33 | 1547 | 55.25 | 91.81 | 6 | 50.73 |
| Player | Inns | Runs | Average | 100s |
| Martin Guptill | 75 | 2062 | 27.49 | 2 |
| Roshan Mahanama | 72 | 2069 | 29.14 | 3 |
| Grant Flower | 84 | 2373 | 29.29 | 5 |
| Kris Srikkanth | 72 | 2062 | 29.88 | 2 |
| Graham Dowling | 71 | 2177 | 31.55 | 3 |
| Pankaj Roy | 74 | 2220 | 31.71 | 4 |
In Tests, Guptill's biggest problem has been tackling the new ball and the fast bowlers when conditions are often favourable for them. Against pace in the first 15 overs of an innings in Tests, Guptill's average is 26.61, and he scores at a strike rate of less than 50 during this period. In the same period in ODIs, Guptill's average is 42.75, and he scores at a strike rate of 83 against fast bowlers.
The comparison that best encapsulates Guptill's Test and ODI numbers, though, is his head-to-head stats against Josh Hazlewood in the two formats. In Tests, Hazlewood has been all over Guptill, dismissing him four times in 119 deliveries, and conceding only 32 runs - that is, an average of eight runs per dismissal, and a strike rate of 27. In Tests, racked with self-doubt and uncertainty regarding the best approach against a bowler of nagging accuracy and great skill, Guptill has come a cropper, hitting only four fours in 119 balls.
In ODIs, the narrative of the contest changes completely. Armed with greater confidence, an uncluttered mind, and the freedom to attack, Guptill has dominated the contests, hitting 92 runs off 97 balls without being dismissed. The sheer contrast of these two comparisons aptly summarise the Test and ODI journeys of Martin Guptill.
| Match type | Runs | Balls | Dismissals | Average | Strike rate |
| Tests | 1038 | 2086 | 39 | 26.61 | 49.76 |
| ODIs | 2779 | 3350 | 65 | 42.75 | 82.95 |
| Match type | Runs | Balls | Dismissals | Average | Strike rate | 4s/ 6s |
| Tests | 32 | 119 | 4 | 8.00 | 26.89 | 4/0 |
| ODIs | 92 | 97 | 0 | _ | 94.84 | 8/4 |
S Rajesh is stats editor of ESPNcricinfo. @rajeshstats