How good are Kohli, Smith, Williamson and Root at occupying the crease?
An analysis of the survival rate of the top Test batsmen today
Himanish Ganjoo
19-Sep-2019
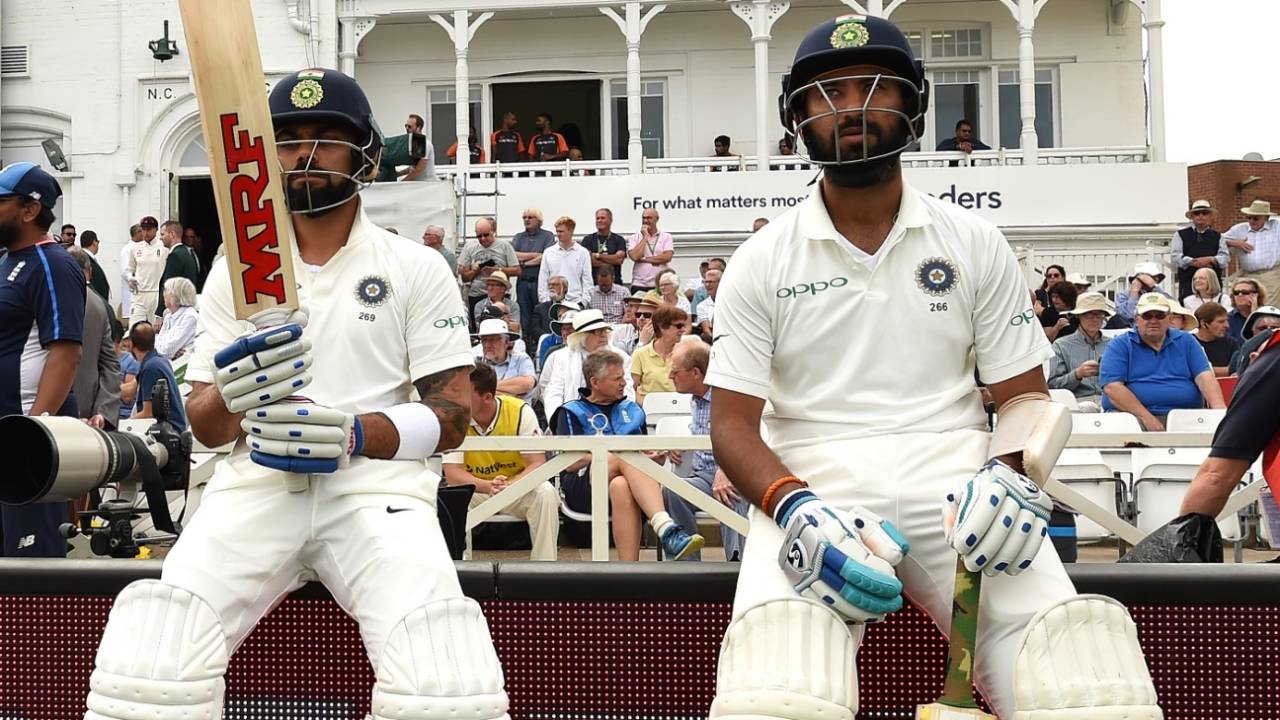
Virat Kohli and Cheteshwar Pujara: different types of batsmen but both with a huge appetite for staying at the wicket • AFP
The 2015 Delhi Test between India and South Africa was the first I ever watched live. Eclipsed by India's most comprehensive win in terms of runs was a rearguard blockathon for the ages, orchestrated by Hashim Amla, AB de Villiers and Faf du Plessis. Well into the T20 era, a sparse but dedicated crowd watched as 143 runs were made in 143 overs. People even counted ball milestones and celebrated them. Deliveries, rather than runs, had become the counter of achievement.
For a batsman, Test cricket is about surviving the tough periods. The ability to occupy the crease is essential. It helps in building partnerships, wearing the ball and the bowlers down, and setting yourself up for the chance to capitalise on easier conditions.
And yet, while the value of eating up deliveries is recognised, it is seldom given enough importance in terms of conventional statistics. The batting average is always in focus, but there is no simultaneous mention of the balls faced per innings. If the bowling strike rate is an important measure of a bowler's efficacy, why are the balls per dismissal not discussed when talking of batsmen?
Test batting has never been more difficult than today. The pitches offer some assistance to bowlers, and batsmen come to the format after making easy runs in white-ball cricket. In 2019, a wicket falls every 51 balls, the lowest since 1911. Surviving at the crease is a vanishing skill and lapses of concentration are more common. Why not look at the quality of individual batting by considering players' chances of staying at the crease beyond the average player, who falls every 50 balls or so?
Let's consider the 50-ball threshold as the average survival rate. This corresponds to roughly 25 runs, a figure denoting a "start". It is well known that batsmen are vulnerable at the start of their innings, and thus, reaching the milestone of 50 balls can be counted as having "got in": being set at the crease after having weathered the initial hazardous period.
This 50-ball line is going to be central in this piece. We will consider stats from the start of 2015 to the third Test of the 2019 Ashes and players who have played more than 40 innings in this period.
The first question is: How often do successful batsmen cross this 50-ball barrier? Who crosses it most often?
To no one's surprise, Steven Smith leads this chart. He crosses 50 balls 68.4% of the time - that is, in more than two out of three innings - which is a testament to his remarkable consistency and obduracy. Closely following him is Cheteshwar Pujara, with his strategy of cutting out risk-taking before being completely settled.
Younis Khan's last two years in Test cricket bring him to third position. That he lasted 50 balls or more three out of five times on average partly explains Pakistan's success as a Test side during his and Misbah-ul-Haq's era.
At four and five are two New Zealanders, true to the trope of their being understated, quiet performers. Kane Williamson, despite having played fewer Tests than the other three in the "Fab Four", has a figure of over 60%. Keeper-batsman BJ Watling makes a claim for being the best of his kind today. A keeper who crosses 50 balls 60% of the time is an asset for any side.
Virat Kohli's propensity to attack outside his off stump makes his batting a spectacle, but also leaves him vulnerable early on, more so than other top batsmen.
Joe Root has been going through a rough patch of form and has crossed 50 balls a little more than half the time since 2015.
While openers averaged 74.4 balls per dismissal overall from 2015 to 2017, the last two years have been torrid for them, with the balls-per-dismissal figure falling to 59. Openers have survived past 50 balls only 43% of the time since 2015. Tom Latham and the stoic Dean Elgar are the only ones with figures over 50%. Azhar Ali (49.2%), Alastair Cook (46.4%) and M Vijay (44.2%) are the only others performing better than average.
Crossing a barrier is one virtue, but cashing in is also essential. If you do manage to settle in and cross 50 balls, how long do you stay at the crease on average? Who digs in and plays the long innings?
Azhar might not cross the line as often as other top batsmen, but he has played some humongous knocks when he has gone past 50 balls, including two double-centuries and a triple.
Cook, despite a fall in form in the twilight of his career, was tough to dislodge if he battled through the initial period, staying in for 160 balls on average.
Pujara, who seemed to bat forever in Australia last season, slots in in third place. His reputation as a massive gobbler of deliveries is well reflected in his average innings length of 159 balls if he settles in. Latham, Smith, Usman Khawaja and Vijay make up the club of batsmen who play out around 150 balls on average if they make it past 50 balls.
Plotting the two quantities together shows us the players who are good at both these aspects of long-form batting: consistency in crossing the 50-delivery threshold, and accumulation in going big and occupying the crease. Smith, Pujara, Williamson and Kohli form their own little elite cluster at the top right.
A combination of both these factors tells us the survival rating of a batsman: how often they cross a given barrier, and how big they go if they do cross it, combined into one metric, the Survival Value.
Let's use the survival value to look at the career progression of the four batsmen at the top right of our scatter plot, and add Root to the comparison.
From the above, we see again that Kohli has always been the more risk-taking batsman in this group, susceptible to getting out when compared with Smith, Williamson and Pujara.
Pujara's survival value rose in the home season and fell back when he toured South Africa and England, rising again after his good performances in Australia, and then falling with a drab series in the Caribbean.
Smith has had an almost unchecked rise, only dipping due to his failures in South Africa, and now rising again after a supreme Ashes series, which now takes him to the top of the table.
Despite a stellar beginning to his Test career, Root has been a few notches below the other four since 2015, and has almost steadily fallen in his last 40 innings or so.
In The Art and Science of Cricket, Bob Woolmer talks about "danger points" for a batsman: "At certain times batsmen are more vulnerable psychologically, and therefore more likely to lower their mental defences and make an innings-ending mistake. These moments - known as danger points - are usually caused by lowered intensity and a dip in concentration… a score of 60 to 70 is one of the most dangerous…"
Can we find what points in an innings are the most dangerous? Let's look a little deeper at the five batsmen we chose above.
The hazard function, more illuminatingly called the failure rate, is a tool from the field of survival analysis. It simply tells you a batsman's relative rate of getting out at a certain point in the innings, given that the batsman has already reached that point. For example, to find someone's hazard at 90 runs, I take all the innings that have crossed 89 runs and then find the probability of getting out at 90.
This splits open the actual patterns of survival, enabling us to see when exactly a batsman is vulnerable, akin to Woolmer's "danger points".
So what are the danger points for our five batsmen?
In the first ten balls, Root is the most susceptible of the five to getting out. If he manages to survive that period, he is quite solid over the course of his innings until he hits his nemesis of a 50-plus score, which corresponds to 120-plus balls. His hazard shoots up abnormally, highlighting his unhappy pattern of being unable to convert fifties to hundreds.
Kohli begins circumspectly, but he is prone to throwing it away consistently between 30 and 70 balls as he unfurls his strokes. He is more risk-taking than the others, as evidenced by the regular occurrence of peaks up until the 110-ball mark. Once past that, he is almost impossible to get out as can be seen from his superb conversion rate of fifties to hundreds.
Smith is far and away the best batsman today for a reason. His curve sneaks underneath those of the others in most places. He offers two small windows of opportunity for bowlers, at 90-100 balls and 110-130 balls, but barring those, he is unlikely to lose out on a big score.
Williamson's brilliance too is reflected in how his curve stays below those of the others for the most part.
Pujara shuts shop in his first 25 balls or so, not offering any shots, content with leaving or blocking. His lapses of focus come after 50 balls faced, most notably in the 70-80 and 100-110 ball region. His strike rate at the start of his innings means he scores about 30 runs in the first 100 balls, which means his batting average suffers.
Looking at batting numbers alone ignores the quality of the bowling itself. The deliveries to which batsmen get out - are they wicket-taking balls or is the player throwing it away? How difficult are the balls they face?
CricViz's Expected Wickets model utilises trajectory data from all balls bowled in Test cricket since 2006. It applies machine learning to predict the probability of each ball getting a wicket, taking into account the characteristics of the delivery: the line, length, speed, spin, swing and seam. It helps quantify the wicket-taking ability of a delivery, independent of what the batsman does. Here is a full explainer.
Using this model, we can calculate the expected balls per dismissal, or "expected dismissal rate" of a batsman, given all the deliveries they face. Accounting for the properties of the kind of bowling he faces, this number tells us how likely an average batsman is to get out. A player who faces tougher bowling will have a lower expected dismissal rate. The actual dismissal rate is just the balls per dismissal for that batsman. The difference between the two tells us how a given player fares compared to the average batsman facing the exact same deliveries.
Data is available until the third Ashes Test. Let's look at the difference between the expected and actual dismissal rates for our chosen five batsmen.
Root gets the most high-quality wicket-taking balls, as shown by his low expected balls per dismissal, although the difference between him and the other four is not much. Interestingly, Smith gets the easiest balls on average.
The "difference" column quantifies the ability of a batsman to survive at the crease while accounting for the bowling he faces. This value is the highest for Smith and Pujara. Smith plays a whopping 61 balls more than the average player is expected to, given the quality of bowling he faces.
Another virtue of a batsman is whether it takes a good ball to get them out. The Average Wicket Quality tries to quantify this. This is the mean wicket-taking probability of all the balls that a batsman gets out to and it tells us about the quality of the balls that get a particular batsman out.
While Root, Smith and Pujara form a bunch in the middle, it is Kohli who has the highest percentage. The balls that get him out have a 7.73% chance of getting the average batsman out, which is by far the highest among the five under consideration.
At the other end of the list, Williamson curiously gets out to relatively innocuous balls. His dismissal deliveries are likely to get a wicket only 4.7% of the time on average. He is most susceptible to the batting equivalent of an unforced error.