Who is the best ODI batter? Is it Tendulkar, Kohli, Richards, or Ponting?
A comprehensive rating system to rank the top players in the format
Anantha Narayanan
May 10, 2025, 2:32 AM
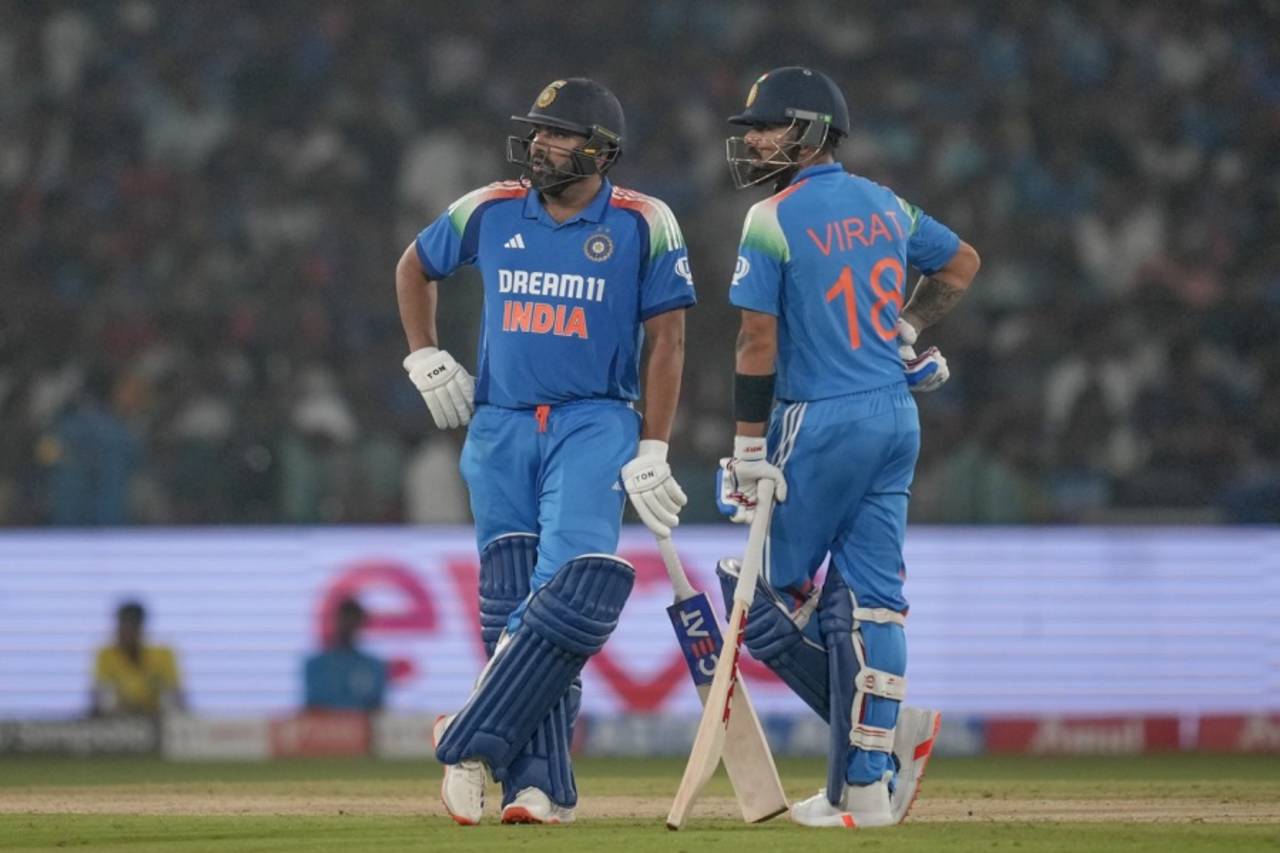
If Virat Kohli and Rohit Sharma stick around till the 2027 ODI World Cup, or add another 2000 runs each to their tally, Kohli could top the list and Rohit could break into the top three of greatest ODI batters list • Associated Press
Around five years ago, I came out with an in-depth look into ODI batters with a view to determining the best ODI batter of all time. I would say that it was almost certainly the definitive final list. However, a few batters were still active then and were approaching the last third of their careers: Virat Kohli and Rohit Sharma, to name two. Both belong to the all-time-great category. A lot has happened during these five years. These two have won a world ODI title and have just about maintained their high numbers. It is also true that these two are on the verge of retirement. That leaves most of the great batters having retired or about to retire. Hence, I felt that this is the time to bring out a definitive and almost final list of great ODI batters.
The first thing I decided was to cut down the weight of the longevity-oriented parameters still further. The basis of the 2020 analysis was very sound and I have used most of those parameters and classifications. I retained the core, added a few parameters, dropped a few, but adhered to the objective of increasing the performance-oriented weights. The net result is a very clearly laid-out analysis of top ODI batters.
The qualifying mark is 2500 ODI runs. A total of 205 batters qualify. My apologies to Vinod Kambli, who missed selection by a mere 23 runs, and Chamu Chibhabha, who missed by 26 runs.
Let me first present the schematic of the current analysis. Before going into that, let me explain what is Weighted Batting Average (WBA).
The WBA is my own derivation, and arguably, my best creation. At one stroke, this measure removes the gross disparity that exists in calculation of the traditional Batting Average in terms of totally ignoring not-outs, in both Tests and ODIs. Imagine Martin Guptill's 237 and Fakhar Zaman's 210 (and Brian Lara's 400 and Garry Sobers' 365) not being considered as innings while calculating their batting averages. And that 28.3% of the innings MS Dhoni played are ignored while only 3.8% of the innings David Warner played are not considered. The middle-order batters get a lot of possibly undeserved benefit while the top-order batters lose out in a significant way. That is blatantly unfair to Warner and the like.
The WBA is calculated by assigning proportional innings values for all the not-out innings below the concerned batter's RpI value. Of course, all dismissals and all not-out innings above the concerned batter's RpI value are assigned innings values of 1.0. With this single simple change, all the above referenced problems are solved. Let me also affirm that this is not being unfair to the middle-order batters. Rather, it is being fair across the spectrum of batters - irrespective of their batting positions.
The weights are given based on the importance of the measure. It is important to score runs. It is equally important to score runs quickly, especially if the team is setting a target. We must reward those who scored more runs or scored their runs faster than their team members. Finally, it is essential to identify how the individual batters fared when compared to all the batters who played during their career spans. We have to recognise the context-based achievements and the performances in World Cups and similar events. And give credit to those who faced tough bowling line-ups.
1. Weighted Batting Average (WBA) - 22.5 pts
The WBA receives the joint highest weight of 22.5 points. These are distributed in the following manner:
- 15.0 points for the absolute WBA value. This is allotted to a WBA value of 55.0. Shubman Gill has the highest WBA of 51.2. Kohli and Babar Azam are the only other batters to have WBA values very close to 50 (both have the same WBA value of 49.83). Wasim Akram is last in this measure with a WBA of 14.12.
- 5.0 points are allotted to the comparison value of the WBA of the batter and all his team-mates who batted in positions 1-7. This is a highly customised derivation in that the figure is exactly calculated from the batter's first to the last ODIs. The maximum value is allotted to a percentage value of 200.0. Zaheer Abbas tops in this measure since he stood head and shoulders above his compatriots, at 186%.
- 2.5 points are allotted to the comparison value of the WBA values of the batter and all the other batters who batted in positions 1-7. This is also a highly customised derivation in that the figure is exactly calculated from the batter's first to the last ODIs. The maximum value is allotted to a percentage value of 200.0. Abbas again tops in this measure with a comparison value of 172% with the other batters.
2. Strike Rate (SR) - 22.5 pts
This is a major change from my 2020 analysis. In the new ratings, the SR receives the same weight of 22.5 points as the WBA. These are distributed in the following manner:
- 15.0 points for the absolute SR value. This is allotted to a SR of 130.0. Glenn Maxwell has the highest SR of 126.7. Shahid Afridi and Jos Buttler are the only other batters with strike rates exceeding 115. At the other end of the spectrum, we have Mudassar Nazar, whose strike rate was 51.7 - which was pedestrian even by 1980s standards.
- 5.0 points are allotted to the comparison value of the SR values of the batter and all his team-mates who batted in positions 1-7. The same customised derivation is done. The maximum value is allotted to a percentage value of 175.0. Afridi tops in this measure with a comparison value of 157% with his compatriots.
- 2.5 points are allotted to the comparison value of the SR of the batter and all the batters who batted in positions 1-7. The same customised derivation is done. The maximum value is allotted to a percentage value of 175.0. Afridi tops in this measure as well, with a comparison value of 154% with the other batters.
3. Performance Rating Points (RP) 10.0 pts
Readers would know that the BAT-100 and BOW-100 Performance Rating points take into account every aspect of the game and are fully contextual. As such, these are very important while evaluating a player's career. There are two elements in this segment.
- 5.0 points for the batter's average RP per innings. This is a measure of the overall consistency of the batter in tough situations. The maximum value is allotted to an RP average value of 30.0. Gill tops in this measure with an average RP value of 29.6.
- 5.0 points for the batter's highest RP value - in other words, his best performance. This is a measure of the brilliance of the batter in a really tough situation. The maximum value is allotted to an RP value of 100.0. Maxwell tops in this measure with a highest ratings value of 93.0 for his once-in-a-millennium double-century against Afghanistan in the 2023 World Cup.
4. Innings Value Index (IVI) - 5.0 pts
The IVI is a single measure that encompasses the relevant scorecard-based values pertaining to an innings such as strike rate, support given/available, percentage of team score etc. It covers the support as well as the performance aspects. There are two components in this analysis segment.
- 2.5 points for the IVI average per innings. The maximum value is allotted to an IVI average value of 3.0. Abbas tops in this measure with an average IVI value of 2.95.
- 2.5 points for the batter's highest IVI value - in other words, his best performance. The maximum value is allotted to an IVI value of 20.0. Maxwell tops in this measure with a highest IVI value of 18.23 for his double-century.
5. Career Runs (Longevity-based) - 10.0 pts
This is straightforward and rewards longevity in terms of career runs scored. The maximum value is allotted to a career runs value of 20,000. Not surprisingly, Sachin Tendulkar leads in this measure with an aggregate of 18426 runs and an allotment of 9.21 points.
6. Average Bowling Quality faced - 5.0 pts
This is an average value of the career-to-date average values of the top-four bowlers of the other team. It is weighted by the runs scored. The maximum value is allotted to a Bowling Quality value of 30.0. Batters facing a team with bowling average of 40.0 and above get zero allocation. Maybe unexpectedly, Craig McMillan leads in this measure with an average bowling quality faced of 32.3. In his ten-year career, he faced the might of Australian and West Indian bowlers often. On the other extreme, Calum MacLeod and Kyle Coetzer of Scotland faced a bowling line-up of near-40 average.
7. Cup-related achievements - 10.0 pts
There are two components to this cup-related measure. These are not longevity measures although it may seem so at a surface level. The quality of the team comes into play. However, ultimately the runs scored and cup achievements are performance-oriented, in that these are the pinnacles in the career of a player.
- 5.0 points for runs scored in key World Cup, Champions Trophy matches like finals, semi-finals, quarter-finals, Super Sixes, Super Eights, multi-nation tournaments etc. These are weighted by the importance of the concerned match. The maximum value is allotted to a weighted-key-runs value of 1500. Not surprisingly, Ricky Ponting leads in this measure with an aggregate of 1363 runs. This is a major departure from the 2020 analysis in that I have tightened the qualification criteria to change this from a longevity-measure to something more significant. Only runs scored in important tournament matches are included. Ponting scored four hundreds in the key World Cup/Champions Trophy matches, including the 140 in the 2003 World Cup final.
- 5.0 points for World Cup/ Champions Trophy related achievements such as World Cup title wins (3.0), World Cup runners-up (1.5), Champions Trophy winners and finalists (1.0 and 0.5), six-nation tournament winners and finalists (0.5 and 0.25). The maximum value is allotted to a points aggregate of 15.0. Again, as expected, Ponting leads in this measure with an aggregate of 12.5 points. No doubt, the three World Cup wins helped his cause.
8. X-Factors - 15.0 pts
These are five special minor measures that are important but do not warrant a separate classification. The total value is 15.0 points.
PotM Award Frequency - 3.0: This relates to the frequency of the Player-of-the-Match awards. As such, it is a performance measure. Viv Richards leads with 6.0 matches per PoTM award.
Partnership Index (PSI) Ave - 3.0: PSI is a measure of the number of significant partnerships the batter was involved in, during his innings. Jonathan Trott leads with a PSI average of 1.15.
Percentage of Team Runs - 3.0: This is straightforward. Abbas leads, having scored 21.5% of his team's aggregate.
Opening Average - 3.0: A batter has to have opened in a minimum of ten ODI matches to qualify for this. Shai Hope leads with an opening batting average of 51.9 in 49 innings. Hashim Amla and Travis Head are the only other batters with opening averages exceeding 45.
Finishing Runs (Longevity-based) - 3.0: These are the relevant and meaningful runs scored during the later part of the innings. Finisher extraordinaire, Dhoni, leads with a collection of 2923 finishing runs.
Thus it can be seen that the longevity-based measures only comprise of 13% of the total. That leaves 87% for performance-based measures. Even in my 2020 analysis, I had around 20% oriented towards longevity measures. A total of 19 parameters are used and only two of these are longevity-oriented.
A word or two of appreciation for Abbas, who leads in four of the measures. The artist with the silken touch was an outstanding performer at a time when run-accumulation was the order of the day. He and Viv Richards were the stand-out batters of the 1970s and '80s. Maxwell leads in three segments while Ponting, Gill, and Afridi lead in two segments each.
Let us now move onwards to the top ODI batter tables. The first table is the key one listing the top 15 ODI batters.
Sachin Tendulkar was on top in 2020, and he retains that position now as well, despite the reduction in longevity-oriented weight. It shows that he was an outstanding ODI batter delivering consistently in a career of more than 20 years. I have always felt that Tendulkar was the best ODI batter in his generation and across generations, but was, at best, in the top ten among Test batters. Time to tip our hat to the Little Master, a true legend. But it must be said that the reduction in longevity measures has helped narrow the gap between him and the second-best batter considerably.
Virat Kohli has narrowed the gap to Tendulkar from around ten points to one. The match-winning innings in the Champions Trophy semi-finals also helped. He also leaped past Ponting and Richards. Despite Kohli's not-so-great recent form, he is on his way to becoming the best ODI batter in the next year or so. My quick calculation indicates that if Kohli scores around 2000 more runs and/or does reasonably well in the 2027 World Cup (if he plays till then), he has every reason to go to the top position in the ODI top batters' table. The only way that he will not reach the top is if he retires sometime during 2025-26.
Viv Richards has gone above Ponting to be in third place. His performance-oriented measures are valued slightly more and this has helped him go past Ponting. He was a giant among the ordinary performers of his era. His unbeaten 189 ruled the roost for over three decades as the best ever ODI innings until Maxwell's double-hundred. Richards' match-winning 138 in the 1979 World Cup final is in sixth position of all-time best ODI innings. Two World Cup wins and a runner-up position are the glittering highlights of Richards' career.
Ricky Ponting is in fourth place, dropping two places because of the changes in valuation process. He is the leader, by a country mile, in the World Cups segment. Ponting had three World Cup titles adorning his trophy board. His 140 in the 2003 World Cup final was an emphatic match-winner.
A modern great, Rohit Sharma, has made the most significant move up, from 12th position to fifth. There is no doubt that the Champions Trophy win helped Rohit achieve this move, with his match-winning 76 in the final worth a lot. His batting at the top helps - nine of his last 12 hundreds have been better than run-a-ball efforts. Where Rohit might finish is an interesting point. If he finishes his career as indicated for Kohli (another 2000 runs and/or World Cup 2027 performances), he is almost certain to leapfrog Richards and Ponting. That would give Indians the top three places. This is almost certain unless he retires sometime during 2025-26.
Two of the game's most exciting players, AB de Villiers and Adam Gilchrist are in the next two places. These two are among the most gifted batters ever, the likes of whom we will never see again. De Villiers is, arguably, the most exciting ODI batter ever.
Gilchrist's World Cup performances are second only to Ponting, and Richards is not far behind. Gilchrist's 149 in the 2007 World Cup final was an all-time great innings, never to be forgotten. The fact that the top seven have three of the most exciting players ever to play the game convinces me that whole basis is a sound one.
Kumar Sangakkara, David Warner and Sanath Jayasuriya complete the top ten list. All of them were giants of the game and have helped their teams achieve laurels in the world arena. It was clear that Jayasuriya changed the face of ODI opening batting. Sangakkara is second only to Tendulkar in the runs aggregate measure. Warner did not score many runs but had excellent WBA and SR values.
The next five are MS Dhoni, Hashim Amla, Brian Lara, Virender Sehwag, and Sourav Ganguly. Not one of them is out of place. Each had a great strength. Dhoni was a finisher extraordinaire while the others were top-drawer top-order batters. For all the emphasis on Sehwag's Test strike-rate achievements, he scored at better than a run a ball in his 251-match ODI career.
A few notable batters and their placings further down the list, below the featured 15.
- Even though his aggregate is only 2775 runs, Shubman Gill is placed just outside the top 15, in 16th position, mainly because of his very high WBA and ratings values.
- Despite his recent struggles, Babar Azam, is in the 21st position. Whether he will move up further is a moot point.
- Shai Hope is in 31st position. If he continues to do well, he should move up further.
- Travis Head is in 39th position and is bound to move up as he plays his trademark firecracker game in the matches to come.
- Riding on his quick-scoring exploits and the amazing 200, Glenn Maxwell is in 38th position.
- Shahid Afridi's low WBA has pushed him to the 71st position, a somewhat low place for an explosive, standout batter.
Guy Whittall props up the table with a points tally of 33.0 points. He is just behind Stuart Carlisle (36.0) and Adam Parore (36.3).
Now we move on to the support tables. These cover the parameters in a little more depth, based on some logical groupings. One thing all readers should be aware of is that the three support tables are in the order of the final rating points and only the top 15 are shown in these tables. This is done so that the key numbers for the top 15 batters are available for perusal by the readers who do not take the trouble to download the exhaustive excel sheet provided. Hence, the batters mentioned in the narrative for that table, who would have done well on those specific attributes, might not feature among the names in the table itself. This dichotomy between the table and narrative has to be understood. Also, remember that the totals referred to in the narratives are not displayed.
The first, and the most important group is a combination of the two most important performance-based measures - the WBA and SR. These are further broken down into three measures each. These two form the very essence of successful ODI batting - score more, and score quickly. No batter can hope to be in the elite group of batters if he does not do well in both. There is a total weight of 45% for these two measures.
Gill has the highest value for this combination with 35.77 points. His WBA is 51.2 and he scores at an imposing strike rate of nearly 100. That is an amazing combination indeed. Kohli comes close behind with a value of 34.52 points. His numbers are second only to those of Gill - WBA of 49.8 and a strike rate of 93.3. De Villiers is in third place with 34.40 points. His WBA is 45.1 but he has a strike rate exceeding a run a ball (101). These are indeed the acknowledged kings among ODI batters. In this measure, the difference between the top and bottom batter is not much. Nazar is at the bottom of the table with 19.27 points (A bottom-of-the-barrel WBA of 23.97 at 51.7 explains why).
Since these are the two most important of performance measures, I have provided the leaders in the two segments separately. Gill leads in the WBA segment with 19.60 points and Maxwell leads in the SR category with 20.79 points.
This is a combination of assorted measures, such as Rating (ave and highest), IVI (ave and highest), career runs, Bowling Quality faced, and cups-related (key runs and cup-achievements). These are further broken down into a total of eight measures. These are a combination of important longevity and performance measures. These measures are worth 40% of the total value in terms of weight.
Not surprisingly, Ponting leads in this measure with 28.81 points. His World Cup achievements are legendary and he scored just over 13,700 runs at a good average. Tendulkar follows with 28.62 points, thanks to his aggregate of 18,400 as well as his reasonable cups-related achievements. Kohli follows with 25.79 points. He has some chance of overtaking Ponting since he will keep adding to his career runs as he continues to play, and could also do well in the 2027 World Cup. At the bottom of the barrel is Whittall, with 9.76 points. No doubt a total of 2700 runs and a zero accumulation of World Cup points are the reasons.
The third group is a set of five lower-level measures, grouped under a consolidated X-Factor. The five are PotM award frequency, per cent of team score, PSI average, opening average, and finishing runs. These are important facets of any ODI batter's repertoire. Together these give us an overall idea of how an ODI batter performed in differing aspects of the game. The X-Factor weight is 15% of the total.
Amla leads in the X-Factor category with 9.53 points. He does well in the first four sub-classifications. Hope follows closely with 9.51 points. He is almost exactly like Amla. In a surprise placement, Geoff Marsh is in third place with 9.50 points. He does reasonably well in every aspect, including the finishing-runs category. The lowest points compilation is for Moin Khan, with 2.48 points. He gets 0.0 in two of the categories - PotM and opening batting.
The complete data for the 205 qualifying batters - both ratings and data values - has been uploaded in the form of an Excel sheet that is available for downloading.
It is very unlikely that I will do a complete analysis like this in the near future. Hence where do I see the table in, say, a couple of years? Let me play Nostradamus on the important updates. My conjecture is that Kohli will move to the top, displacing Tendulkar. I will keep this analysis going as time goes by. If and when Kohli reaches the top, I will trigger a brief to all the readers. It will indeed be a significant day in ODI cricket. For those of us who put Tendulkar on a pedestal based on certain inimitable characteristics, it will be time to put Kohli on top, albeit based on different player traits.
Tendulkar will remain in second place, comfortably ahead of Rohit, who will move to third place. Thus there will be an India 1-2-3 on the list. Their retirement from the T20I cricket scene should give Kohli and Rohit a couple of extra years in ODIs. Richards and Ponting will remain in fourth and fifth positions. I also expect that Gill will move comfortably into the top ten in the coming two to three years or so.
The quirky stats section
This time the potpourri is a collection of Test innings in which one partnership exceeded 75% of the innings score, with the caveat that ten wickets should have fallen in the innings. So, it was a question of two batters doing almost everything on the day, with very little contributions from others.
This time the potpourri is a collection of Test innings in which one partnership exceeded 75% of the innings score, with the caveat that ten wickets should have fallen in the innings. So, it was a question of two batters doing almost everything on the day, with very little contributions from others.
Lara and Jimmy Adams contributed nearly 80% of their team score in 1999 during a match-winning partnership against Australia in Kingston. In the following year, Mahela Jayawardene and Sangakkara contributed nearly 78% to the total of 216 against South Africa in Durban. Finally, in 2016 in Mirpur, Tamim Iqbal and Mominul Haque contributed in a significant way in Bangladesh's first Test win over England.
Talking Cricket Group
Any reader who wishes to join my general-purpose cricket-ideas-exchange group of this name can email me a request for inclusion, providing their name, place of residence, and what they do.
Any reader who wishes to join my general-purpose cricket-ideas-exchange group of this name can email me a request for inclusion, providing their name, place of residence, and what they do.
Email me your comments and I will respond. This email id is to be used only for sending in comments. Please note that readers whose emails are derogatory to the author or any player will be permanently blocked from sending in any feedback in future.
Anantha Narayanan has written for ESPNcricinfo and CastrolCricket and worked with a number of companies on their cricket performance ratings-related systems