England's No. 3 problem, and IPL's 11th-over syndrome
One-down has been a source of worry for England for a while now
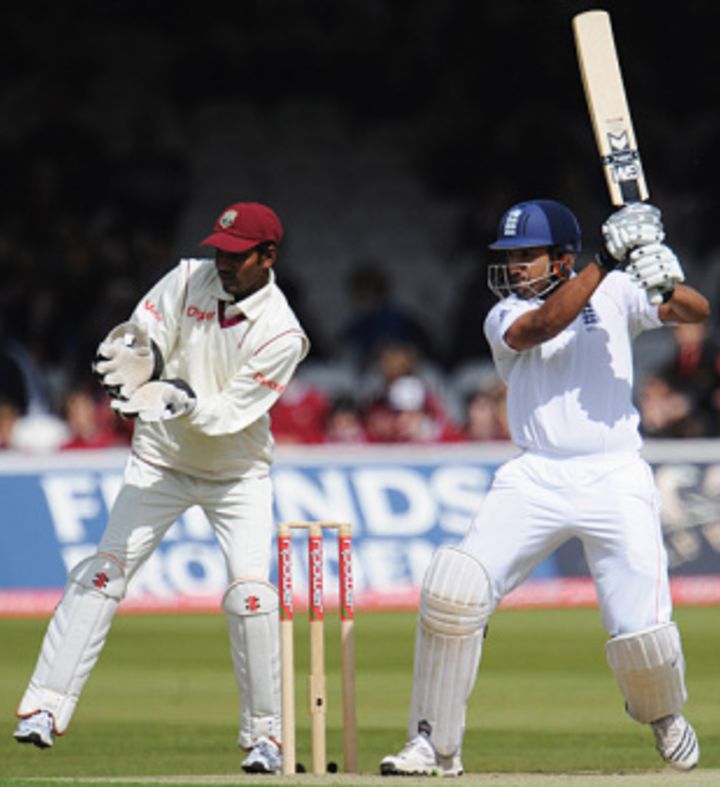
Ravi Bopara's fluent 143 in the first Test against West Indies at Lord's ended a 22-innings century drought for England's No. 3 batsmen, and more importantly, the manner in which he played also offers hope that England may have at last found a long-term solution for a position that has troubled them for a long time.
England's openers have been among the more successful pairings in world cricket in this decade: in 121 Tests since 2000 they average more than 42, with only the Australian and South African openers having better numbers - the Australian openers average almost 50, while South Africa's average 45.47. At one-down, though, England's quality has dropped dramatically: in 218 innings since 2000, only 20 centuries have been scored by England's No. 3s, and the average of 38.31 is significantly lower than that for most of the top teams. The Australians, for example, have played 32 fewer innings at No. 3 but have scored 13 more hundreds, and their average of 60.73 is by far the highest. They've also been helped by the presence of a settled batsman at that slot: Ricky Ponting has played at that position in 87 out of 106 matches.
Similarly, Sri Lanka haven't had to look beyond Kumar Sangakkara, while Rahul Dravid has made that position his own for India. Not surprisingly, these are the only three teams that average more than 50 for the No. 3 spot. England, on the other hand, languish in eighth place, with only Zimbabwe and Bangladesh ranked lower.
| Team | No. of batsmen | Tests | Runs | Average | 100s/ 50s |
| Australia | 12 | 106 | 9960 | 60.73 | 34/ 37 |
| Sri Lanka | 10 | 88 | 7173 | 52.35 | 18/ 33 |
| India | 10 | 100 | 8192 | 51.84 | 20/ 38 |
| South Africa | 14 | 106 | 7418 | 44.68 | 18/ 39 |
| Pakistan | 13 | 76 | 5379 | 42.69 | 15/ 17 |
| New Zealand | 16 | 75 | 5049 | 40.71 | 11/ 21 |
| West Indies | 16 | 102 | 6886 | 39.57 | 20/ 27 |
| England | 14 | 121 | 7892 | 38.31 | 20/ 38 |
| Zimbabwe | 10 | 44 | 2252 | 28.87 | 5/ 10 |
| Bangladesh | 13 | 59 | 3202 | 27.84 | 3/ 23 |
Mark Butcher did the job with a fair amount of consistency for England between 2001 and 2004, getting past fifty 23 times in 69 innings, but since then the one-down position has struggled to inspire confidence. Michael Vaughan had an excellent conversion ratio, scoring six centuries and only two fifties, but he also failed far more often - he touched 50 once every 4.75 innings, and in his last eight innings at that position, scored 134 runs.
England's stats have also been dragged down by a couple of batsmen who occupied the position for fairly long periods without justifying their selection: Nasser Hussain batted 31 innings at No. 3 and averaged less than 30, while Ian Bell was only marginally better in his 16 Tests. It's too early to pass a definitive judgment on Bopara, but early indications are that he might just lift England's ranking in the table above if he hangs on to that slot for a reasonable amount of time.
| Batsmen | Tests | Runs | Average | 100s/ 50s |
| Mark Butcher | 40 | 2709 | 42.32 | 6/ 17 |
| Michael Vaughan | 24 | 1494 | 40.37 | 6/ 2 |
| Ian Bell | 16 | 930 | 31.00 | 0/ 9 |
| Nasser Hussain | 20 | 839 | 29.96 | 2/ 4 |
| Alastair Cook | 7 | 578 | 52.54 | 2/ 2 |
| Robert Key | 8 | 532 | 40.92 | 1/ 2 |
| Owais Shah | 6 | 255 | 28.33 | 0/ 2 |
| Andrew Strauss | 3 | 231 | 46.20 | 1/ 0 |
The 11th over syndrome in the IPL
Eduard from South Africa sent in an interesting request a few days back: "Could you please publish a distribution of when wickets are falling (by over) in the 2009 IPL? I have read a lot of commentary about the first and eleventh overs. I think it would be a very insightful piece of trivia." So, Eduard, here goes.
As you'd expect, the wickets fall in a heap in the last five overs, but if you exclude the last five, then the first and 11th overs are among the most dangerous for batting teams. Twenty-one wickets have fallen in the first over, at an average of 15 and a run-rate of less than a run a ball.
The 11th over is even more interesting, as teams have lost 20 wickets at an average of less than 18, which is significant since the overs around it all have averages of more than 20. Also, few wickets have fallen just before and after the 11th - only 12 each in the 10th and 12th overs, and at a considerably higher average. In fact, the average in the 12th is more than twice that in the 11th. The break probably has much to do with it, but the numbers are also slightly skewed because of the 12-over match between Punjab and Delhi, when Punjab lost three wickets in the 11th over in a match in which the tactical timeout was taken after six overs, not 10.
The other interesting stat is that the run-rate in the seventh over is significantly less than in the sixth - obviously batsmen have preferred to take a breather after the Powerplays.
| Over no. | Runs | Wickets | Average | Run rate |
| 1 | 324 | 21 | 15.42 | 5.40 |
| 2 | 386 | 18 | 21.44 | 6.43 |
| 3 | 448 | 12 | 37.33 | 7.46 |
| 4 | 500 | 13 | 38.46 | 8.33 |
| 5 | 520 | 14 | 37.14 | 8.69 |
| 6 | 464 | 20 | 23.20 | 7.86 |
| 7 | 352 | 17 | 20.70 | 5.96 |
| 8 | 417 | 9 | 46.33 | 7.06 |
| 9 | 364 | 16 | 22.75 | 6.16 |
| 10 | 401 | 12 | 33.41 | 6.87 |
| 11 | 367 | 20 | 18.35 | 6.30 |
| 12 | 489 | 12 | 40.75 | 8.43 |
| 13 | 420 | 20 | 21.00 | 7.36 |
| 14 | 389 | 15 | 25.93 | 6.92 |
| 15 | 428 | 20 | 21.40 | 7.68 |
| 16 | 454 | 27 | 16.81 | 8.59 |
| 17 | 496 | 14 | 35.42 | 9.53 |
| 18 | 502 | 23 | 21.82 | 9.65 |
| 19 | 440 | 29 | 15.17 | 8.74 |
| 20 | 420 | 38 | 11.05 | 9.43 |
Among all teams in the IPL, Delhi Daredevils and Deccan Chargers have handled the 11th over better than the others. Delhi haven't lost a wicket in the 11th, but have grabbed seven (including three in that 12-over game against Punjab). Deccan have lost one, but they've also scored at a better rate than any other team. Chennai and Rajasthan have been struck by the 11th over curse as well, but fittingly, the team that brings up the rear in this aspect too is Kolkata Knight Riders, if only to prove that they're worse than the other teams in all departments. When batting, they've lost four wickets and scored at less than five an over in the 11th, and when bowling they've failed to take a wicket.
| Team | Bat - wkts lost | Average | Run rate | Bowl - wkts taken | Average | Run rate |
| Delhi Daredevils | 0 | - | 6.00 | 7 | 6.28 | 6.13 |
| Deccan Chargers | 1 | 63.00 | 7.87 | 3 | 14.67 | 5.50 |
| Mumbai Indians | 1 | 40.00 | 5.71 | 2 | 18.50 | 5.28 |
| Rajasthan Royals | 2 | 26.50 | 7.39 | 1 | 37.00 | 5.28 |
| Chennai Super Kings | 3 | 13.67 | 5.85 | 2 | 28.00 | 8.00 |
| Royal Challengers Bangalore | 4 | 12.25 | 6.12 | 3 | 17.33 | 6.50 |
| Kings XI Punjab | 5 | 10.40 | 6.50 | 2 | 22.00 | 7.33 |
| Kolkata Knight Riders | 4 | 8.25 | 4.71 | 0 | - | 6.62 |
The first over has been tough to negotiate for the batsmen as well, but particularly difficult has been the opening delivery of the innings. Including S Badrinath's dismissal on Thursday, the first legitimate ball of an innings has fetched a wicket nine times in IPL 2009. The contrast with last year's tournament couldn't be starker.
| Year | Runs | Wickets | Average | Runs per over |
| 2008 | 96 | 1 | 96.00 | 4.96 |
| 2009 | 21 | 9 | 2.33 | 1.96 |
All IPL stats updated till the end of match No. 32 on May 6, except the last table, which is updated till the end of match no. 34.
S Rajesh is stats editor of Cricinfo
Read in App
Elevate your reading experience on ESPNcricinfo App.