Celebrating 3500 ODIs
An analysis of one-day internationals, breaking up the 3500 games played so far into five sets of 700 each
Ric Finlay
01-Aug-2014
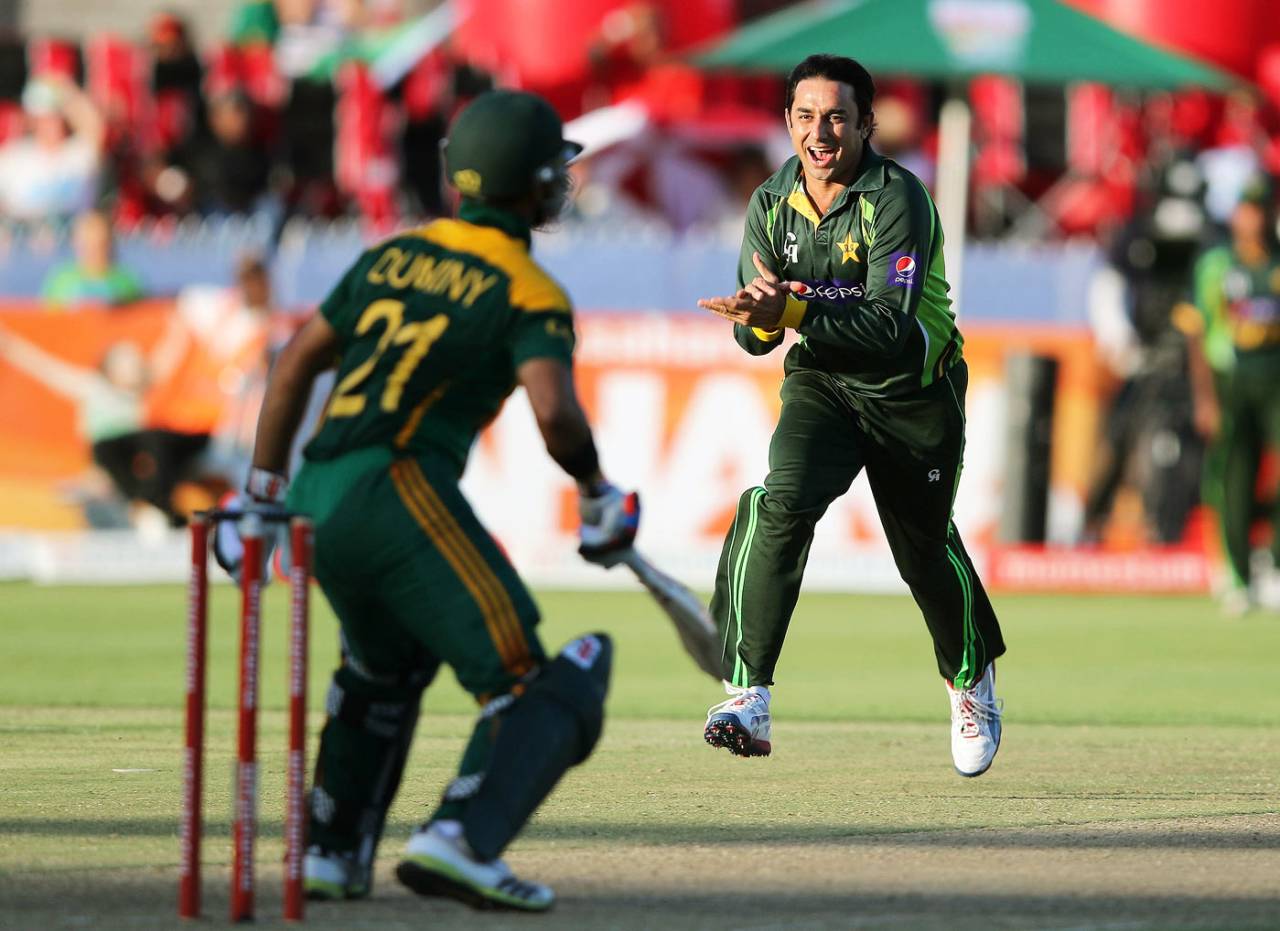
In the last set of 700 ODIs, Saeed Ajmal has taken 178 wickets at 21.97, which is remarkable given that batsmen have generally dominated this period • AFP
The passing of the 3500th ODI last month creates an opportunity to analyse the evolution of this particular form of cricket over forty-three and a half years since the first was played in January 1971. This averages out to 80 such games a year, but it took a while for the ODI idea to catch on, and it wasn't until 1992, more than 20 years after the first, that a calendar year had as many as 80 ODIs. The frequency reached a peak in 2007, when there were 191 ODIs (including a convoluted World Cup), but the number played per year has plateaued since then as the T20 juggernaut has gained momentum, and 2012 (which had 90 ODIs) was the first year since 1995 when fewer than 100 were played.
I have divided the ODI era into five periods, each containing exactly 700 matches, and we can use this division of the experience to observe the changing frequency patterns.
You may observe the exponential decline in the time elapsed to reach each increment of 700 ODIs, until the last period, when the advent of T20 cricket has necessarily meant a reduction in its nearest imitator to accommodate the new form. There has been speculation that ODIs may be sacrificed in favour of the shorter 20-over game, but with 136 played in 2013, and 54 so far this year, it is clear that we are far from hearing the death knell for the 50-over game.
It is interesting to note some key indicators over each of these five periods:
These measures show that batting has become much easier over the ODI era, due to a variety of factors. Fielding restrictions (and Powerplays), shorter boundaries, flatter pitches and improved bat technology have all no doubt contributed to this, so that we can observe that the runs-per-wicket measure has increased 8%, the scoring rate 17%, boundary runs 34% and the frequency of centuries 84% over the era. The escalation in the number of "ducks" in the third period is an interesting one. It may be that initially batsmen were keen to play themselves in, much like in Test innings, and that the urgency to score right from ball one wasn't seen as much as an imperative as it perhaps became later. But overall, the above table is validation of the theory that ODIs have become much more of a batsman's game.
Looking at the dominant players, the following tables show the five leading batsmen for each period:
Batting (Runs and Average)
The number of years required to stage 700 ODIs early in the era was too large for some of the great players of the 1970s and 1980s to appear in the above table more than once, but with the contraction of time needed to clock up 700 ODIs in the 1990s and beyond, it has been possible for the likes of Tendulkar, Sangakkara and Dhoni to appear more than once. The dominance of India, Sri Lanka and Pakistan, who take up 17 of the 25 spots, is clear, and it points to the fact that these teams tend to retain their proven stars for longer than teams outside the region perhaps do, as well as the increasing popularity of this form of cricket on the subcontinent, leading to more matches being played. There are only three batsmen from Australia, two from South Africa, and none from England or New Zealand, while West Indies' dominance in the 1970s and '80s is clear: they have three out of the five top players in the first period.
The number of runs to gain admittance to this select group in later periods is lessened by the fact that more of each set of 700 ODIs contains matches played by Associate teams, thus lessening the opportunity for these top batsmen to play. But a cursory glance at the individual averages gives the distinct impression of increasing productivity as time has gone on, with three of the five in the fifth period exceeding 50 runs per innings, a landmark than had been unattained in the previous four periods.
Bowling (Wickets and Average)
Fourteen of the 25 players in the bowling table come from the subcontinent - a slightly lower proportion than with the batting, but in line with generally shorter bowling careers, only one, the durable Muralitharan, appears more than once. Pakistan had a potent attack in the second period, with Wasim Akram and Waqar Younis, followed by the spin of Saqlain Mushtaq, a fearsome prospect. There are a few surprises in the table, with Abdul Razzaq, Irfan Pathan and Nathan Bracken. It is interesting to note that after the raw speed of the bowlers of the first period, spinners become more prevalent thereafter, as the value of this type of bowler becomes more widely respected from the 1990s. In line with the increasing cost of wickets in more recent times, the bowling averages tend to blow out a little - even Lasith Malinga, considered one of the most effective short-form bowlers, was prone to leaking runs in between his destructive wicket-taking bursts. In this context, Saeed Ajmal's average of under 22 is outstanding.
Finally, a table of results for the ten Test-playing teams:
Countries by Winning Percentage
One of the saddest points to be made from this table is the abject and well-documented decline of West Indies, who have suffered a reduction of their winning percentage at every stage from their dominance of the first period, so much so that even lowly Bangladesh have exceeded West Indies' performance in the last period. Once West Indies had lost their edge, built on a plethora of fast bowlers and mercurial hitters, Australia and South Africa took over to share dominance thereafter. England's fortunes have also suffered a steady decline over the ODI era, although improved performances over the last few years have resulted in an improved position in the last period. Pakistan have never been far from the top-ranking teams, until the last period, when the enforced exile from their own country has taken from them the advantage of having a home base in which to play at least half their matches.
Given their huge resources, India's performance over the ODI era is less impressive than expected, but their ranking in the last period may be an indicator of things to come from this hugely supported team. It is interesting to note, too, the subdued percentages of the top teams in the last period, compared to the two prior periods, when Australia was able to win at least seven games out of ten. This latest trend is an indication that competition at the top level is now more even, which makes the outcome of the forthcoming World Cup intriguing, to say the least.