The Richards Standard for ODI batsmen
Which modern-day batsmen can match the speed and certainty of Viv Richards' run-making?
Kartikeya Date
Nov 25, 2013, 10:03 AM
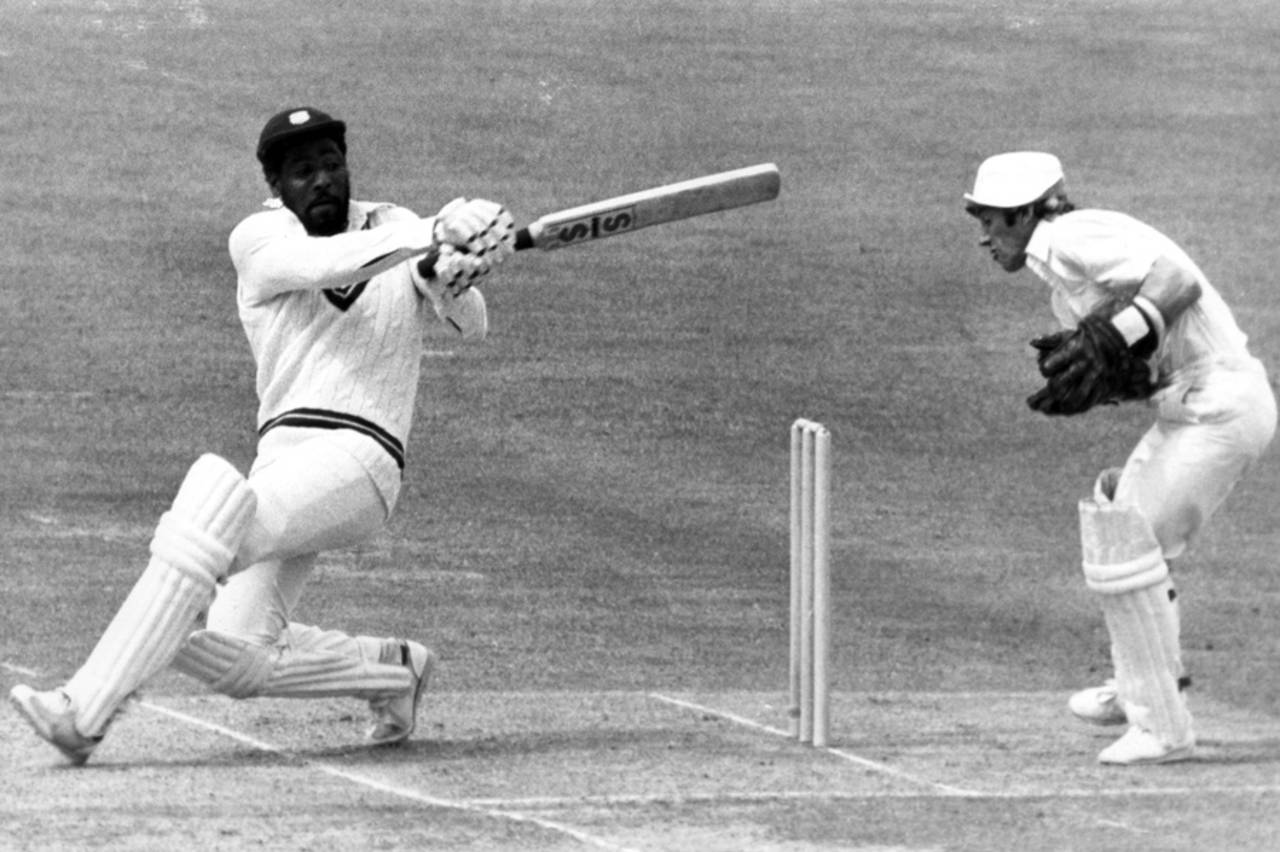
Viv Richards scored a century every 15 innings in ODIs during an era when the norm was one every 61 innings • Getty Images
One-day cricket has not seen a batsman dominate the way Bradman did in Tests. Viv Richards comes very close, though. In the Richards era, which ran from the beginnings of limited-overs internationals to the eve of inventions like the 30-yard circle, fielding restrictions and pinch-hitting, the average scoring rate for middle-order batsmen (3, 4, 5 and 6 in batting order) was 70 runs per 100 balls. Richards scored his runs at 90 runs per hundred balls. His ODI batting average at the end of his career was an even 47. A typical middle-order batsman averaged 30. ODI centuries were rare. During Richards' career, 80 ODI centuries were scored in 4921 innings in the middle order, one in every 61 innings. Richards made 11 in 166 innings, or one every 15 innings. Every sixth inning played in the middle order was worth 50 or more between 1975 and 1991. Richards made a half-century every three innings.
The speed and certainty of Richards' run-making in ODI cricket was unmatched in his day. The distance between his ability to produce runs in ODI cricket (leave alone the style in which he made them) and that of the typical ODI batsman remains, I suggest, unmatched to this day. He achieved the highest-ever rating in the ICC's ODI Player Ratings. But even Richards' career numbers, impressive as they are, do not convey the dominance of his play. His average over his first 100 ODI matches was 53, over his best stretch of 100 ODI matches, 58. His career record, like that of many great players in both formats - ODI and Tests - should be read by adding about five runs to his career average to get a true measure of how good he was. See the Test records of Miandad, Ponting, Tendulkar, Gavaskar and even Richards in the same way. At their peak, each of these batsmen averaged closer to 60 than 50.
When compared to the numbers produced by today's top batsmen, Richards' figures look less exceptional. Over admittedly shorter careers so far, AB de Villiers, Hashim Amla, Virat Kohli and MS Dhoni have produced arguably more impressive figures than Viv Richards. The typical middle-order ODI batsman in the 1990s scored at 71 runs per 100 balls. In the 2000s, this rose to 75, in the 2010s it has risen further to 78. The batting average of the typical batsman has risen to 34 in the 2010s from 30 in Richards' era.
A fairer measure across eras is one that considers how far ahead of contemporaries a batsman is. Here is one way to make such a measure. This will form the basis of the Richards Standard for ODI batsmen, to go with the Bradman Standard for Test batsmen and the Barnes Standard for Test bowlers.
I propose that each batsman's performance in each innings is best measured by a Score that takes into account the batsman's run share (the fraction of the team's runs scored by the batsman), and scoring rate ratio (the ratio of the batsman's scoring rate in the innings, to the combined scoring rate for all the other runs in the innings). A batsman who is dismissed for 0 would have a Score of 0 for the match. A batsman's career score will be the average of all his match scores. Here are the career Scores of all ODI batsmen who made at least 9000 runs.
When have these players been at their peak? And how far ahead of their peers were they at their peak? I'll use 100 matches as the span for the Richards Standard. This is admittedly an arbitrary figure (101 or 99 of 108 would be just as reasonable, and I hope some of you readers will figure out a novel way to say which is more reasonable). I chose it because it typically takes about four or five years for a player to play 100 matches, a period long enough to account for more than just a blistering run of form (the kind Virat Kohli has been in recently).
This Richards Standard Score measures the importance of a batsman in ODI cricket in a given era. Important batsmen are central to a team's batting fortunes. It's harder for individual batsmen in strong batting outfits to be highly influential. Strong outfits can afford to lose the odd player for a series or two without suffering too much in terms of run output. In the tables below, I present the top 100 batsmen in terms of a 100-match Richards Standard Score. Each of these batsmen have played more than 100 games, and hence, have more than one sequence of 100 consecutive ODI matches. I consider their highest stretch, which is given by the start and end date.
These figures represents the period when each player has produced his highest score. Sachin Tendulkar, for example, has had more prolific 100-match stretches. His most prolific 100-match stretch was from April 7, 1998 to January 28, 2002, when he made 4796 runs. This is also the most prolific 100-match stretch for any batsman. But his Score during this phase was lower. The most remarkable figures in this list are those of Adam Gilchrist and Virender Sehwag, and to a lesser extent (given his low average), Sanath Jayasuriya. Sri Lanka, between 1996 and 2000, were not a big-scoring ODI team, but invariably managed to score enough runs for their Murali-led attack to defend. Gilchrist batted in a very successful Australian side from 2002 to 2006. The Indian side Sehwag played in between 2005 and 2011 was in a very successful phase after Ganguly had been replaced by Sehwag. It would lead India to the 2011 World Cup. The bulk of Sehwag's record was built up after his recall to the Indian side in 2008. The difference between South Africa and Bangladesh is clear when you compare Graeme Smith and Tamim Iqbal, who achieve the same Score. Smith averaged 12 runs more than Iqbal.
Some of the players who rank high in the list do so because the teams they played in were in decline. The West Indies sides Chris Gayle played in between 2006 and 2012 (an eventful period off the field for the Jamaican) had some top players like Chanderpaul, Sarwan and Samuels, but didn't have the authority of Gilchrist's Australian line-up or Sehwag's Indian line-up. The same can be said of Brian Lara during his period of domination. West Indies were a more successful side in the Lara phase than in the Gayle phase in my chart.
The most unfortunate batsman, in some ways, in the lists below is AB de Villiers. He has consistently produced astonishing numbers for South Africa. He bats in the shadow of Jacques Kallis and, to a lesser extent, Hashim Amla, and after a powerful South African top four, which limits his importance. Even so, he remains the highest-ranked South African on the list. Javed Miandad is the highest-ranked Pakistani player, while Allan Lamb is the highest-ranked Englishman. Brendon McCullum ranks higher than any other New Zealander.
If you were to ask the question: "Who are the most important ODI batsmen at a given time?", the charts above would give you a better answer than simple aggregates or averages or strike rates or century counts. The man after whom the standard is named remains the most important batsman in ODI history.