The best batsman across formats?
Over the last five years, AB de Villiers has been the only batsman to average more than 60 in both Tests and ODIs
S Rajesh
14-Mar-2014
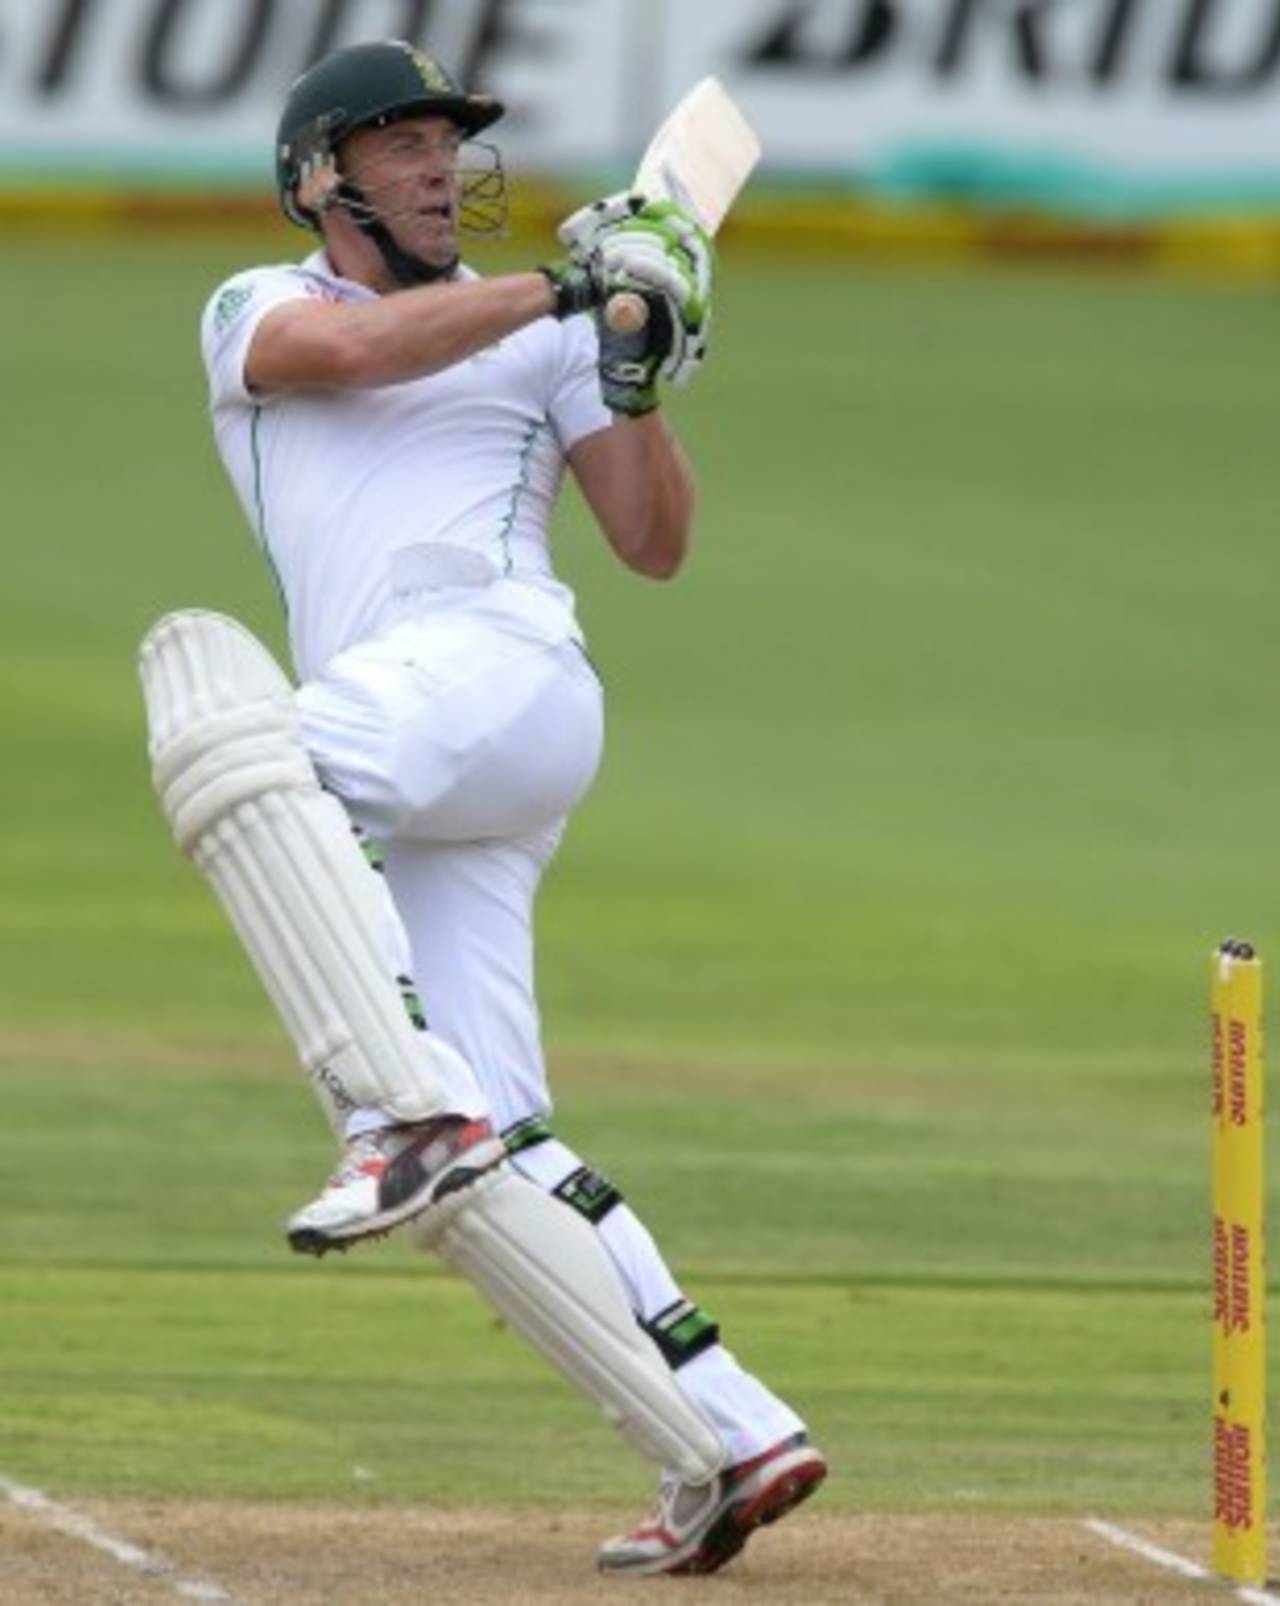
Till the end of 2008, AB de Villiers averaged 30.34 in 26 home Tests; since then, he has averaged 63.05 in 25 home Tests • Getty Images
AB de Villiers holds the record for playing the maximum number of innings before getting his first duck in Test cricket. Between his debut, in December 2004, and November 2008, de Villiers played 78 Test innings and opened his account every single time, before the second Test of the 2008-09 series against Bangladesh. After having scored only 3 in the first Test, in Bloemfontein, de Villiers made his first duck - stumped by Mushfiqur Rahim off Shakib Al Hasan - at the venue aptly named Centurion.
When he scored that duck, de Villiers' Test average dropped to 40.52, after 46 Tests. (Click here for his cumulative Test stats.) The next Test he played was a historic one in Perth later that year, when South Africa chased down 414 in the fourth innings, with de Villiers contributing 63 and 106 not out in that match. Since then, he has been on a tear, in both the long format and the short one. His numbers in Twenty20 internationals don't do justice to his attacking skills and innovative batting, but in the IPL he has been a huge force especially in the last two seasons.
Since the beginning of 2009, de Villiers has racked up eye-popping numbers in both Tests and ODIs. Compared to a Test average of less than 42 before 2009, his post-2009 average has shot up to 64, a leap of more than 53%. He has averaged more than 55 in each of his last six Test series, four of which have been against Australia and Pakistan, and one each against India and New Zealand. The last time he averaged less than 40 in a series was in February 2010, in a two-Test series in India, when he scored 68 from three innings; since then, in 13 series, he averaged more than 100 three times, between 50 and 99 six times, and between 40 and 49 on four occasions.
Similarly, his ODI numbers have soared as well, with the average going up from 36.40 to 62.51, a rise of almost 72%. Along with that, the strike rate has gone up to very nearly a run a ball - he has 4001 runs from 4002 balls during this period. De Villiers is also the only batsman during this period to average more than 60 in both Tests and ODIs.
| Matches | Runs | Average | Strike rate | 100s/ 50s | |
| Tests - before 2009 | 48 | 3134 | 41.78 | 52.97 | 7/ 15 |
| Tests - since Jan 2009 | 44 | 4034 | 64.03 | 55.16 | 12/ 20 |
| ODIs - before 2009 | 76 | 2330 | 36.40 | 84.91 | 3/ 14 |
| ODIs - since Jan 2009 | 83 | 4001 | 62.51 | 99.97 | 13/ 22 |
| T20Is - overall | 51 | 867 | 21.67 | 121.25 | 0/ 4 |
| IPL - overall | 74 | 1662 | 34.62 | 134.90 | 1/ 10 |
Among all batsmen who've scored at least 2000 Test runs against all teams excluding Bangladesh and Zimbabwe since January 2009, de Villiers is the only one to average more than 60; Hashim Amla is close, with an average of 59.86, while Kumar Sangakkara and Jacques Kallis both average more than 55.
The break-up of numbers are very impressive too for de Villiers during this period: he averages almost 60 against Australia, and more than 39 against every side. (His lowest is 39.72, in seven Tests versus England.) Apart from India, he averages more than 40 in every country, while he does average at least 40 in every continent. In the first five years of his career, his biggest problem was playing at home: he averaged 30.34 in 26 home Tests, and more than 55 overseas; since 2009, his average from 25 home Tests is 63.05, an improvement of almost 108%.
| Batsman | Tests | Runs | Average | 100s/ 50s |
| AB de Villiers | 44 | 4034 | 64.03 | 12/ 20 |
| Hashim Amla | 43 | 4011 | 59.86 | 15/ 16 |
| Kumar Sangakkara | 40 | 3686 | 56.70 | 13/ 15 |
| Jacques Kallis | 39 | 3342 | 56.64 | 15/ 8 |
| Michael Clarke | 62 | 5356 | 53.56 | 18/ 15 |
| Thilan Samaraweera | 34 | 2662 | 53.24 | 7/ 12 |
| Shivnarine Chanderpaul | 33 | 2402 | 52.21 | 6/ 11 |
| Rahul Dravid | 31 | 2640 | 51.76 | 9/ 10 |
| VVS Laxman | 31 | 2259 | 50.20 | 4/ 18 |
| Sachin Tendulkar | 42 | 3228 | 49.66 | 8/ 17 |
Through most of his career, de Villiers has been a part of a strong South African middle order, which means he has often come in to bat with the team in a fairly strong position already. However, there have been instances when he has come in early with the team in trouble, and he done equally well in those situations too. That was most recently in evidence during the home series against Australia, when, in the first Test in Centurion, South Africa were reduced to 23 for 3 by Mitchell Johnson's pace and hostility. De Villiers walked in, and ended up scoring 91 out of a South African total of 206; in the second innings, he walked in with the score reading 49 for 3, and top-scored again with 48, out of a team total of 200. In fact, de Villiers' highest Test score of 278 not out also came from an early entry to the crease, when he came in at 33 for 3 against Pakistan in Abu Dhabi, though that match ultimately ended up as a high-scoring draw.
Overall at No. 5, his stats are consistent no matter when he has come in to bat: he averages more than 67 when coming in with the score less than 60, and almost 47 when coming in between 60 and 119. He obviously relishes batting when the batsmen before him have already scored plenty, averaging 131 in those situations, with five hundreds in nine innings. (Click here for his overall list of innings at No. 5.)
At No. 6, his stats are pretty good when he comes in early, but not so impressive when the batsmen before him have already scored a lot. That's probably also because of the need to score quickly, or the lack of batting support at the other end, when he has come in to bat at No. 6.
| Score (3 down for) | Inngs | Runs | Average | 100s/ 50s |
| Less than 60 | 15 | 811 | 67.58 | 2/ 2 |
| 60 to 119 | 17 | 700 | 46.67 | 2/ 4 |
| 120 to 249 | 17 | 704 | 50.28 | 2/ 5 |
| 250 and over | 9 | 921 | 131.57 | 5/ 1 |
| Score (4 down for) | Inngs | Runs | Average | 100s/ 50s |
| less than 100 | 15 | 736 | 49.07 | 0/ 8 |
| 100 to 149 | 17 | 1074 | 71.60 | 3/ 5 |
| 150 to 249 | 7 | 257 | 36.71 | 1/ 0 |
| 250 and over | 11 | 327 | 36.33 | 1/ 1 |
Along with his impressive Test form, de Villiers has also been an ODI star over the last five years, averaging over 60 while scoring at a run a ball. MS Dhoni is the only other batsman averaging more than 60 during this period, though his strike rate is a slightly lower - but still impressive - 88.27. De Villiers has been unbeaten 17 times in 80 innings, which has ensured a higher average, but even when discounting that and taking the runs-per-innings stat, de Villiers still comes out on top: his runs per innings is 48.34, which, when multiplied by his strike rate of 99.05, gives him a score of 47.88. That's still better than all the other batsmen who've scored 2500 runs against the full members. (All ODIs stats here exclude runs scored against the non-Test-playing sides.)
Among the other batsmen, Amla comes close with an RPI score of 45.39, followed by Virat Kohli's 41.58. Both are top-order batsmen, though, which increases their chances of a higher RPI. Their RPI scores are higher than that for Dhoni, whose RPI is lower because he bats lower down the order. However, his ODI score when calculated by multiplying average by strike rate, is second only to de Villiers'. They are the only two batsmen with 50-plus ODI scores, with Kohli coming in next at 48.98.
| Batsman | Inngs | Runs | Average | Str rate | 100s/ 50s | Ave x SR | RPI x SR |
| AB de Villiers | 80 | 3867 | 61.38 | 99.05 | 12/ 22 | 60.80 | 47.88 |
| MS Dhoni | 100 | 4058 | 61.48 | 88.27 | 5/ 29 | 54.27 | 35.82 |
| Virat Kohli | 119 | 5429 | 53.75 | 91.13 | 19/ 29 | 48.98 | 41.58 |
| Hashim Amla | 70 | 3535 | 53.56 | 89.88 | 10/ 22 | 48.14 | 45.39 |
| Tillakaratne Dilshan | 120 | 4931 | 46.08 | 89.08 | 16/ 19 | 41.05 | 36.60 |
| Shane Watson | 93 | 3760 | 43.21 | 91.79 | 8/ 21 | 39.66 | 37.11 |
| Jonathan Trott | 61 | 2596 | 50.90 | 76.55 | 4/ 19 | 38.96 | 32.58 |
| Kumar Sangakkara | 125 | 5346 | 46.89 | 81.60 | 8/ 40 | 38.26 | 34.90 |
| Michael Hussey | 83 | 2874 | 42.89 | 87.80 | 1/ 22 | 37.66 | 34.47 |
| Gautam Gambhir | 77 | 3038 | 42.19 | 87.37 | 6/ 21 | 36.86 | 34.47 |
What's also remarkable about de Villiers in ODIs is the way he scores his runs. Despite his astounding strike rate, his boundary percentage isn't inordinately high, but his dot-ball percentage is extremely low - he is the only one with a sub-40% dot ratio.
| Batsman | Runs | Balls | Dot % | Boundary % |
| AB de Villiers | 3867 | 3904 | 39.83 | 41.17 |
| Michael Hussey | 2874 | 3273 | 43.60 | 35.07 |
| Suresh Raina | 3304 | 3472 | 45.51 | 45.52 |
| Hashim Amla | 3535 | 3933 | 46.09 | 41.75 |
| Virat Kohli | 5429 | 5957 | 46.84 | 44.24 |
So far, his stats in Twenty20 internationals aren't in keeping with his class and his numbers in other formats. Against the Test-playing sides, de Villiers averages 19.76 in Twenty20 internationals, at a strike rate of 116.81, numbers that do him no justice at all. His average is 37th out of 41 players who've scored at least 500 runs against these sides.
His IPL numbers, though, are outstanding: in the last two seasons, he has averaged 37.72 at a strike rate of 162.8. Over the next few weeks, he'll get an opportunity to right his T20I stats as well. With the form he has been in recently, you wouldn't wan to bet against that.
With inputs from Shiva Jayaraman.
S Rajesh is stats editor of ESPNcricinfo. Follow him on Twitter