The contrasting fortunes of West Indies and South Africa
West Indies' win-loss ratio will slip below one if they lose the series against South Africa, while the reverse will be true for the visitors
S Rajesh
11-Jun-2010
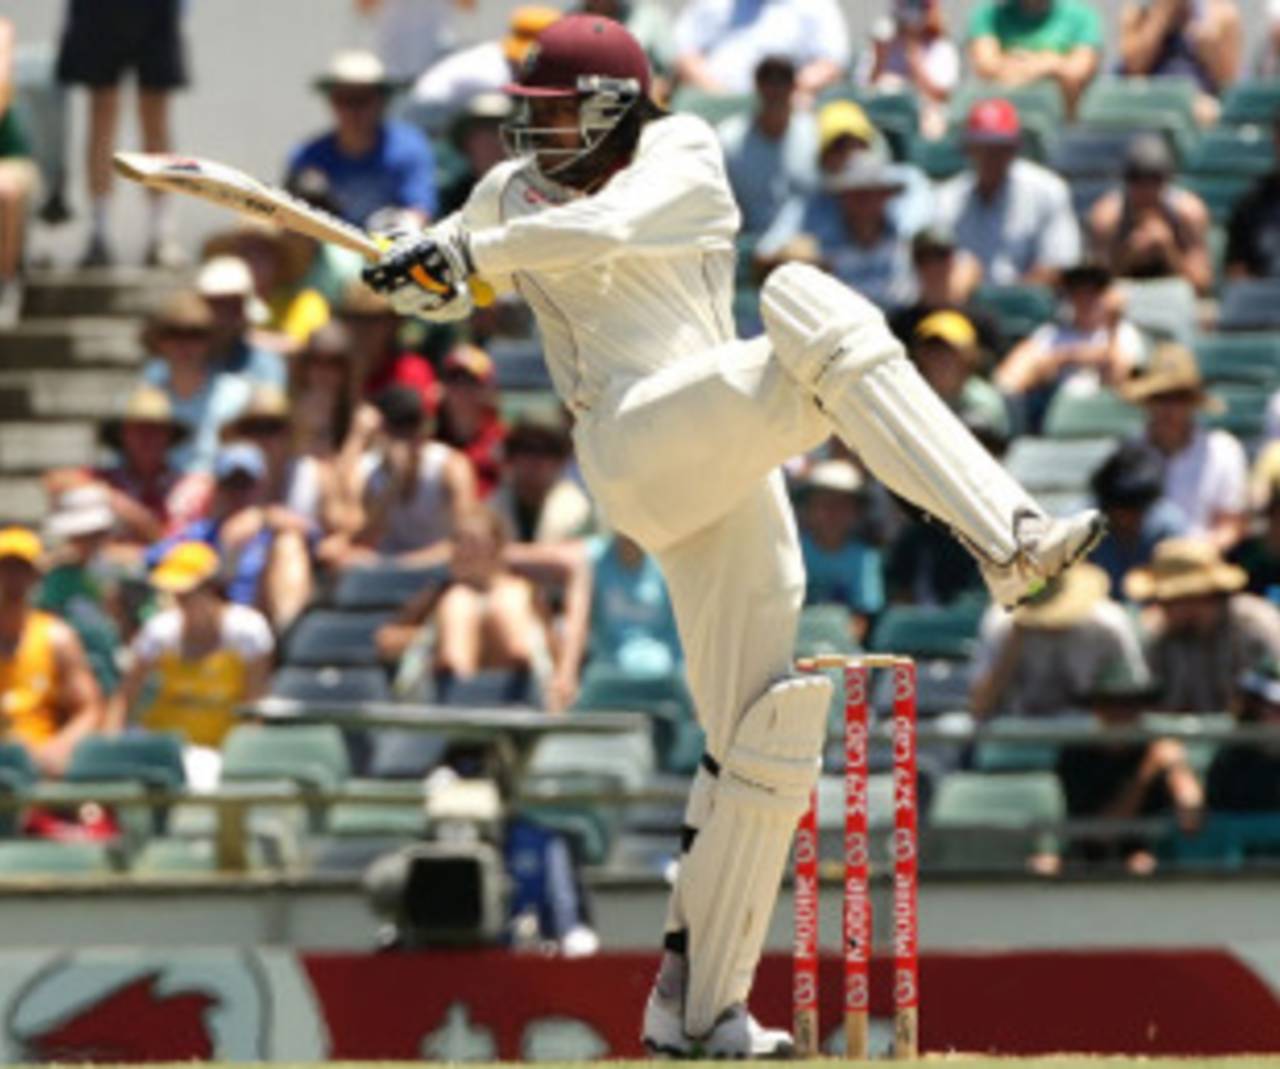
Can Chris Gayle prevent West Indies' overall win-loss ratio from slipping below one? • Getty Images
To say that West Indies have been in the throes of a slump for the last decade and more is to state the obvious. The team and the fans are used to losing, and expectations are pretty low, but another Test defeat against South Africa will mean a new statistical low: for the first time since 1976, their overall win-loss ratio will diminish to less than one. Currently they have won and lost exactly 152 Tests apiece.
For South Africa, on the other hand, the graph has been moving in exactly the opposite direction since their return to Test cricket in 1992, and a win in the first Test in Trinidad will take their overall ratio to one, a mark it has intermittently touched over the last year and a half.
Going by recent form, the visitors have to be odds-on favourites to join Australia, England and Pakistan as the teams with a win-loss ratio of more than one by the time this series is done. Australia's consistently high standards show clearly in their ratio of 1.82, which is well clear of England's 1.21. India have exactly as many wins as Pakistan, but they've taken far more matches to get there, which is reflected in their ratio.
| Team | Tests | Won | Lost | Ratio |
| Australia | 721 | 339 | 186 | 1.82 |
| England | 899 | 315 | 259 | 1.21 |
| Pakistan | 346 | 104 | 95 | 1.09 |
| West Indies | 462 | 152 | 152 | 1.00 |
| South Africa | 350 | 122 | 123 | 0.99 |
| Sri Lanka | 192 | 60 | 69 | 0.86 |
| India | 437 | 104 | 137 | 0.75 |
| New Zealand | 359 | 68 | 145 | 0.46 |
| Zimbabwe | 83 | 8 | 49 | 0.16 |
| Bangladesh | 68 | 3 | 59 | 0.05 |
But let's return to West Indies' sorry story. Their numbers over the last 15 years make for shocking - and very depressing - reading. When they beat England in the third Test of the 1994 home series - incidentally also in Trinidad - their win-loss ratio climbed to 1.67, with 119 wins offset by only 71 defeats. At the end of that Test, West Indies sat proudly as the team with the best overall stats in Test cricket; Australia were next with a ratio of 1.46, while England remained at 1.21. At that point West Indies had won 48 more Tests than they'd lost, and they more or less maintained that difference till April 1996, when they beat New Zealand 1-0 in a two-Test series at home.
The 3-2 series defeat to Australia at the end of that year started the slide, which gathered momentum and assumed alarming proportions in the next decade.
The table below illustrates how quickly things have gone completely pear-shaped for West Indies. Till mid-July 1976, they had won, on average, about as much as they'd lost, though obviously that ratio was much poorer in their early days. The third Test against England in 1976 was the last time their win-loss ratio was less than one. The next 20 years were glorious ones for the Caribbean, as they won far more than they lost, averaging only slightly more than one defeat per year.
While they won about three Tests per defeat during those peak years, the ratio has almost exactly reversed since 1997. In these last 15 years, West Indies have averaged about three defeats per win, which has ensured that the cushion of 48 extra wins they had in 1996 has been completely wiped out.
| Period | Tests | Won | Lost | Ratio in that period | Overall ratio |
| Till July 15, 1976 | 171 | 53 | 54 | 0.98 | 0.98 |
| July 16, 1976 to Oct 1996 | 151 | 72 | 23 | 3.13 | 1.62 |
| Nov 1996 onwards | 140 | 27 | 75 | 0.36 | 1.00 |
South Africa's case is exactly the opposite. Till they were banished from international cricket, they lost two games, on average, per win. Since their return, the ratio has almost reversed, with 84 wins and only 46 defeats. During this period South Africa did manage to achieve the ratio of one very briefly, when they beat Australia 2-1 in Australia in 2008-09. After that heady win, though, they came crashing back to earth, losing 2-1 in the return series at home. The win against India in the Nagpur Test earlier this year meant they had 122 wins and as many defeats, but defeat in the next game brought the ratio back below one. If they do beat West Indies, South Africa will want that ratio to stay above one for a little longer.
| Period | Tests | Won | Lost | Ratio in that period | Overall ratio |
| Till 1970 | 172 | 38 | 77 | 0.49 | 0.49 |
| Since 1992 | 178 | 84 | 46 | 1.82 | 0.99 |
Slow dance
The rhythm of Test cricket has generally increased the world over with batsmen scoring more quickly due to the influence of the limited-overs game, but in the West Indies things have moved the other way. Slow pitches and heavy outfields have made run-scoring in the West Indies more difficult than in any other country. Since 2000, batsmen have scored at about 46 runs per 100 balls in Tests in the Caribbean, which is the lowest among all hosting nations. In terms of number of balls per four or six, the West Indies again lag behind other nations, with an average of one every 17.52 balls.
The rhythm of Test cricket has generally increased the world over with batsmen scoring more quickly due to the influence of the limited-overs game, but in the West Indies things have moved the other way. Slow pitches and heavy outfields have made run-scoring in the West Indies more difficult than in any other country. Since 2000, batsmen have scored at about 46 runs per 100 balls in Tests in the Caribbean, which is the lowest among all hosting nations. In terms of number of balls per four or six, the West Indies again lag behind other nations, with an average of one every 17.52 balls.
| Host country | Tests | Results | Draws | Draw % | Bat ave | Strike rate | Balls per 4 or 6 |
| Australia | 61 | 52 | 9 | 14.75 | 34.00 | 52.25 | 15.57 |
| England | 72 | 55 | 17 | 23.61 | 32.07 | 52.19 | 14.03 |
| South Africa | 56 | 47 | 9 | 16.07 | 30.53 | 50.71 | 14.15 |
| Pakistan | 32 | 22 | 10 | 31.25 | 35.04 | 50.30 | 15.23 |
| New Zealand | 45 | 32 | 13 | 28.89 | 30.68 | 49.62 | 14.30 |
| Bangladesh | 33 | 29 | 4 | 12.12 | 30.02 | 49.41 | 15.18 |
| India | 49 | 31 | 18 | 36.73 | 35.12 | 48.50 | 15.80 |
| Sri Lanka | 54 | 43 | 11 | 20.37 | 30.50 | 48.06 | 16.87 |
| Zimbabwe | 22 | 18 | 4 | 18.18 | 31.24 | 47.55 | 15.72 |
| West Indies | 51 | 31 | 20 | 39.22 | 32.28 | 46.16 | 17.52 |
Looking at the numbers over the previous two decades, it's also obvious that the run rates have gradually been declining, almost in sync with West Indies' status in world cricket. In the 1980s, when the team was in its pomp, the run rate for matches in the West Indies was the highest; in fact it was the only venue with a rate of more than three runs per over. (Batting strike rate hasn't been used since the data for balls faced isn't complete during this period.) Back then the pitches were much quicker and West Indies had a power-packed batting line-up, which obviously helped lift the run rate in matches played in the region.
In the 1990s, the rate dropped a bit even as West Indies' status as the best team in the world was challenged. In the 2000s, the run rate and the rank have slipped considerably. Both urgently need a lift.
S Rajesh is stats editor of Cricinfo