Why Andre Russell rocks the 20-over format
Andre Russell is one of only two allrounders - Dwayne Bravo is the other - to score 2000-plus runs and take 100-plus wickets in T20s since 2013
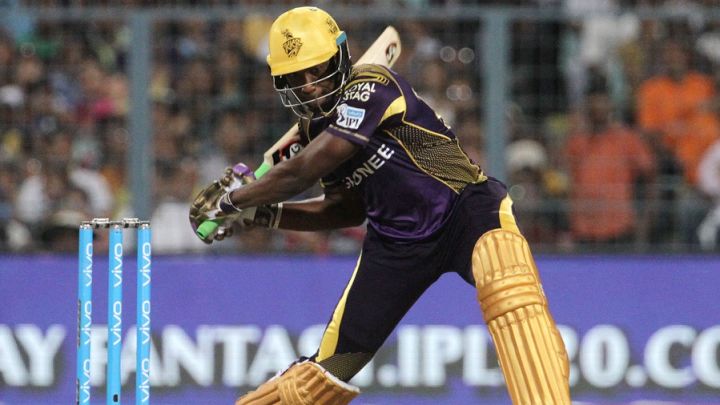
Andre Russell has played only one Test match in his international career so far. In a match remembered for Chris Gayle's 333, against Sri Lanka in Galle, Russell batted at No. 9, made 2 in his only innings, and with the ball had match figures of 1 for 104. His ODI numbers are better: a batting average of nearly 30 at a strike rate of 130, and 64 wickets at a bowling average of 32 and economy rate of 5.8. His 41 T20 internationals have fetched him fair returns as well, but it's really in T20 franchise cricket that Andre Russell has truly made his mark, plying his trade in Australia, India, Bangladesh, England and West Indies. His returns with both bat and ball have been so impressive that Russell is clearly one of the best T20 allrounders going around today.
During the course of the 2016 IPL Russell will turn 28 and play his 200th T20, which means he has both age and experience on his side, to further improve numbers which are already very impressive. In the last three years, especially, he has got his act together with both bat and ball, and his outstanding fielding further adds to the package.
Since the start of 2013, Russell has averaged nearly 25 per dismissal at a strike rate of 170, and has taken a wicket a game at a bowling average of 23 and an economy rate of eight runs per over. The improvement is visible in both departments from the period before 2013, when he averaged less than 20 with the bat and more than 50 with the ball. During this period, he has bowled, on average, three overs per match and faced an average of 11 deliveries in the matches in which he batted, which converts into 18 runs given his strike rate of 170. Very few allrounders have contributed so equally with both bat and ball in T20s; in fact, the only other allrounder with 2000-plus runs and 100-plus wickets in this format during this period is fellow West Indian Dwayne Bravo.
| Period | Matches | Runs | Ave | SR | Wkts | Bowl ave | ER |
| Till Dec 2012 | 44 | 449 | 19.52 | 150.16 | 20 | 50.65 | 8.58 |
| Jan 2013 onwards | 152 | 2347 | 24.96 | 170.07 | 151 | 23.42 | 8.03 |
| Career | 196 | 2796 | 23.89 | 166.52 | 171 | 26.60 | 8.15 |
Clearly, Russell's ability to hit the ball long and hard, and do it consistently, is one of his biggest attributes. Of the 36 instances he has played 15 or more deliveries in T20s since the start of 2013, 18 times he has finished with a strike rate of 200 or more. Twenty-nine times during this period he has scored 30 or more runs in an innings, and his strike rate in these 29 innings is 208.45. The next best, among those who have played at least 20 such innings, is Glenn Maxwell's 183.73, while AB de Villiers is the only other in this list with a 180-plus strike rate.
| Player | Inns | Runs | BF | SR | 4s | 6s |
| Andre Russell | 29 | 1405 | 674 | 208.45 | 111 | 107 |
| Glenn Maxwell | 25 | 1378 | 750 | 183.73 | 117 | 81 |
| AB de Villiers | 28 | 1523 | 843 | 180.66 | 144 | 80 |
| Colin Munro | 23 | 1090 | 629 | 173.29 | 70 | 76 |
| Jos Buttler | 24 | 1122 | 650 | 172.61 | 88 | 59 |
| Kieron Pollard | 36 | 1717 | 1035 | 165.89 | 119 | 113 |
Of the 129 innings for Russell during this period, 97 have been at Nos. 5, 6 and 7, and his numbers at those lower-middle-order slots are extremely impressive: 1906 runs at an average of 28 and a strike rate of 172. The strike rate is obviously the key number during this period, but the average is pretty impressive as well, which indicates he doesn't just hit a couple of big shots and then get out.
| Player | Inns | Runs | Ave | SR |
| Kieron Pollard | 95 | 2221 | 37.01 | 139.94 |
| Andre Russell | 97 | 1906 | 28.02 | 172.48 |
| Ryan ten Doeschate | 77 | 1795 | 30.94 | 137.97 |
| David Miller | 75 | 1739 | 34.09 | 138.12 |
| Dwayne Bravo | 104 | 1731 | 22.19 | 121.72 |
| Darren Sammy | 106 | 1613 | 20.94 | 140.01 |
| MS Dhoni | 55 | 1106 | 39.50 | 140.17 |
| Jos Buttler | 45 | 1093 | 28.76 | 150.34 |
Of the 1380 deliveries Russell has faced in T20s since the start of 2013, 663 have been in the five overs between the 16th and the 20th. As the table below indicates, he has handled the demands of those periods pretty well, striking at more than 186. He is the third-highest run-getter during this period, while his strike rate is marginally better than those of Pollard, David Miller and MS Dhoni.
| Batsman | Runs | SR | Ave | 4s | 6s | Balls per 6 |
| Kieron Pollard | 1641 | 183.35 | 37.29 | 107 | 115 | 7.78 |
| David Miller | 1422 | 183.72 | 38.43 | 94 | 91 | 8.51 |
| Andre Russell | 1235 | 186.27 | 22.05 | 90 | 90 | 7.37 |
| Darren Sammy | 1224 | 164.08 | 19.42 | 84 | 82 | 9.10 |
| MS Dhoni | 1197 | 183.59 | 52.04 | 77 | 81 | 8.05 |
| Ryan ten Doeschate | 959 | 179.92 | 26.63 | 62 | 57 | 9.35 |
| Dwayne Bravo | 927 | 147.61 | 18.91 | 64 | 48 | 13.08 |
| Umar Akmal | 842 | 177.26 | 35.08 | 67 | 48 | 9.90 |
With the ball too, Russell has shown himself to be adaptable and capable of bowling at different stages of an innings. His economy rates are reasonable at different stages of an innings, and he is a wicket-taker in the first six and last five. And while Bravo is clearly the leading wicket-taker in the last five - he has also bowled, by far, the most deliveries - Russell hasn't done badly either, though his economy rate is the poorest among the group below.
| Period of inngs | Balls | Econ | Wickets | Average |
| First six overs | 744 | 7.04 | 40 | 21.82 |
| 6.1 to 15.0 | 1004 | 7.69 | 42 | 30.64 |
| Last five overs | 845 | 9.20 | 67 | 19.35 |
The sum of all that - plus the 74 catches and numerous runs he has saved in the outfield in T20s during this period - adds up to an allrounder who pulls his weight in all aspects of the game. As mentioned earlier, he is one of only two players to score 2000-plus runs and take 100-plus wickets in T20s since the start of 2013. Even if those cut-offs are reduced to 1500 runs and 75 wickets, only three more players make the cut - Shakib Al Hasan, Kieron Pollard, and Ravi Bopara. It's instructive that there are three West Indians in this group of five, and clearly illustrates why they are such a force in this format.
Among these five, Russell has the highest difference between his batting strike rate and his bowling economy rate - he scores 10.20 runs per over, and concedes only 8.03. That, along with the other numbers mentioned above, is a pretty compelling reason to consider him among the very best allrounders playing the T20 game today.
| Player | Mat | Runs | Ave | RPO (bat) | Wkts | Ave | RPO (bowl) | RPO diff |
| Andre Russell | 152 | 2347 | 24.96 | 10.20 | 151 | 23.42 | 8.03 | 2.17 |
| Shakib Al Hasan | 108 | 1927 | 23.50 | 7.70 | 129 | 19.71 | 6.59 | 1.11 |
| Kieron Pollard | 130 | 2679 | 35.25 | 8.64 | 77 | 24.02 | 8.03 | 0.61 |
| Ravi Bopara | 102 | 2281 | 32.58 | 7.52 | 78 | 23.35 | 7.03 | 0.49 |
| Dwayne Bravo | 152 | 2275 | 24.20 | 7.30 | 174 | 22.60 | 7.89 | -0.59 |
S Rajesh is stats editor of ESPNcricinfo. Follow him on Twitter
Read in App
Elevate your reading experience on ESPNcricinfo App.