Visitors outclassed with bat and ball
Although South Africa had a minor hiccup in Durban, they were far too powerful for a Sri Lanka side that struggled to acclimatise to the conditions
Madhusudhan Ramakrishnan
07-Jan-2012
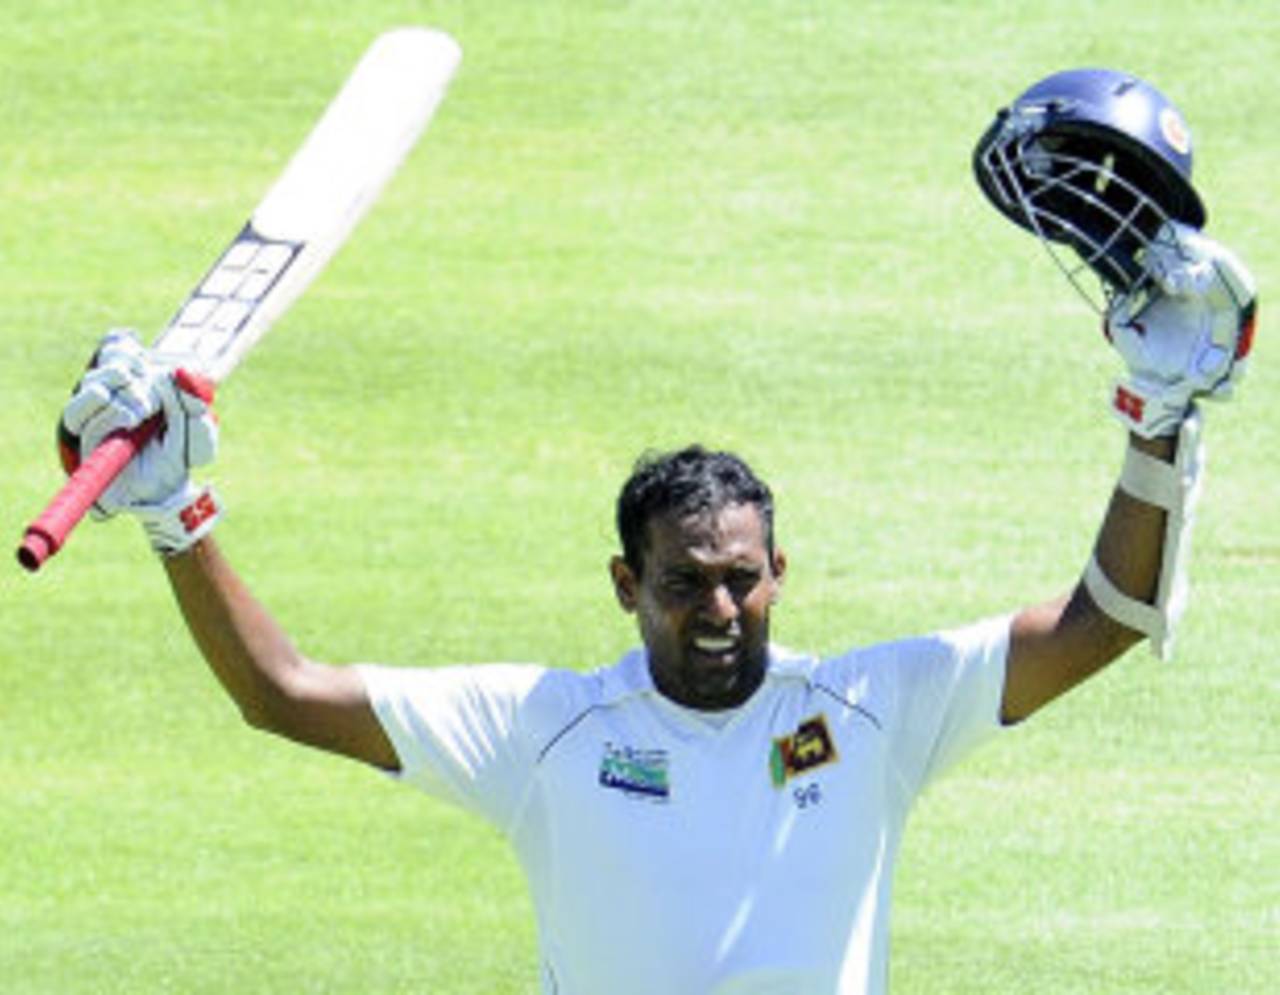
Thilan Samaraweera's aggregate of 339 runs is the highest by a player from the subcontinent in a series in South Africa • AFP
Although the 2-1 margin of victory suggests it was a closely fought series, in reality, the contest between South Africa and Sri Lanka was far from that. South Africa utterly dominated Sri Lanka in the first and third Tests, winning them by an innings and ten wickets respectively. Barring the hosts' batting collapse in the first innings in Durban, which eventually led to their fourth consecutive Test defeat at the venue, they were always well ahead of Sri Lanka in the series. Most of the Sri Lanka batsmen, whose struggles against quality pace bowling were well documented before the series started, were at sea once again on pace-friendly pitches. The lack of a genuine matchwinning bowler in the absence of Muttiah Muralitharan meant Sri Lanka had little chance of reining in a powerful South African line-up that rose to the occasion when it mattered.
South Africa's powerful bowling ensured they had to bat just once in the first and third Tests. It was only in the second Test in Durban that the bowling struggled on an uncharacteristically flat surface. The hosts aggregated almost as many runs as Sri Lanka in two fewer innings. South Africa lost just 34 wickets in the entire series while Sri Lanka were bowled out on every occasion. Sri Lanka put up a strong batting performance in the second Test but a lack of consistency meant that they averaged just 25.46 in comparison with the hosts' 41.23.
| Team | Innings batted | Bat avg | Runs scored | 100/50 | Wickets taken | 5WI/10WM |
| South Africa | 4 | 41.23 | 1402 | 3/7 | 60 | 4/1 |
| Sri Lanka | 6 | 25.46 | 1528 | 3/4 | 34 | 2/0 |
Both teams were under pressure coming in to the series due to vastly different reasons. South Africa had not won a home Test series against any team (except Bangladesh) since the 2-1 win against West Indies in 2007-08, and had frittered away series leads on two occasions, against India and Australia. South Africa were dominated by Australia in 2009 but have statistically been the better side in the four home series played since. While their average difference was 7.64 against England, it increased to 8.54 in the India series and ultimately to 16.23 in the Sri Lanka series.
Sri Lanka were in the middle of a winless streak that went back to July 2010. The visitors had also acquired a reputation of being ordinary outside the subcontinent as they had not managed a single win in Australia or South Africa. Following a high-scoring drawn series in Pakistan in 2008-09, in which Sri Lanka's bowling average was over 100, they failed to win a single Test in their next two series in India and England, but brought down their average difference to -25.14 and -23.01 respectively. A much-improved display in their last two series, against Pakistan and South Africa, meant that their average difference, though still negative, improved to -13.90 and -15.77 respectively.
| South Africa (opposition & result) | South Africa (Bat avg/Bowl avg) | Sri Lanka (opposition & result) | Sri Lanka (Bat avg/Bowl avg) |
| Australia (1-2) | 34.79/36.12 | Pakistan (0-0) | 63.36/125.00 |
| England (1-1) | 38.62/30.98 | India (0-2) | 41.70/66.84 |
| India (1-1) | 37.93/29.39 | England (0-1) | 33.45/56.46 |
| Australia (1-1) | 29.28/24.65 | Pakistan (0-1) | 31.60/45.50 |
| Sri Lanka (2-1) | 41.23/25.46 | South Africa (1-2) | 25.46/41.23 |
The South African opening pair of Graeme Smith and Jacques Rudolph started the series well with an 88-run stand in Centurion, but failed to carry the form into the next Test in Durban. In seaming conditions, the Sri Lanka openers struggled to stitch decent stands together, and that meant that Sri Lanka were almost always off to a poor start. With both Kumar Sangakkara and Hashim Amla having a bad series by their standards, the average second-wicket stand for both teams was under 30. Sri Lanka's middle-order batsmen matched up fairly well to the performance of their South African counterparts, and were responsible for bailing their team out following the repeated failures of the more experienced top-order batsmen. The sixth-wicket stand was particularly notable for the visitors as it contributed to two of the three century stands.
| Partnership wicket | South Africa (Runs, avg) | South Africa (100/50) | Sri Lanka (Runs, avg) | Sri Lanka (100/50) |
| 1 | 174/43.50 | 0/1 | 143/23.83 | 0/1 |
| 2 | 89/22.25 | 0/1 | 152/25.33 | 0/2 |
| 3 | 249/62.25 | 1/0 | 150/25.00 | 0/1 |
| 4 | 288/72.00 | 1/1 | 220/36.66 | 0/1 |
| 5 | 177/59.00 | 1/0 | 289/48.16 | 1/1 |
| 6 | 126/42.00 | 0/1 | 232/38.66 | 2/0 |
AB de Villiers, who scored a century and two half-centuries in the series, was by far South Africa's best batsman. Both his average and balls-per-dismissal value were high against pace and spin. Jacques Kallis, who got his first pair in Durban, bounced back in fine style with a double-century in Cape Town. He did have his problems against left-arm spinner Rangana Herath but was far more comfortable against pace. Both Smith and Amla had ordinary series and were dismissed four and three times respectively by fast bowlers.
Samaraweera, who justified his late inclusion in the team with fighting centuries in the last two Tests, fell more often to the fast bowlers but still ended with a fairly high average. He finished with an aggregate of 339 runs in the series, which is the highest by a batsman from the subcontinent in South Africa. Sangakkara had a woeful start to the series, falling three times in single figures. He did make up with a crucial century in the second innings in Durban, but was vulnerable against pace, averaging just 31.25. Tillakaratne Dilshan, who had a hit-or-miss series, struggled with the bounce and movement and made it past single figures only twice in the series. Mahela Jayawardene, who went past 10,000 runs in Tests, ended with a poor average (17.80) and balls-per-dismissal (41.60) against pace bowlers, which reflected a forgettable series.
| Batsman | Pace (Dismissals, average) | Pace (Balls/dismissal) | Spin (dismissals, average) | Spin (balls/dismissal) |
| AB de Villiers | 2, 125.00 | 157.50 | 1, 103.00 | 245.00 |
| Jacques Kallis | 2, 103.00 | 137.50 | 2, 24.50 | 58.00 |
| Graeme Smith | 4, 27.50 | 84.50 | 0, - | - |
| Hashim Amla | 3, 33.00 | 58.00 | 1, 40.00 | 55.00 |
| Thilan Samaraweera | 4, 65.00 | 133.75 | 1, 79.00 | 195.00 |
| Kumar Sangakkara | 4, 31.25 | 65.25 | 2, 27.50 | 53.50 |
| Tillakaratne Dilshan | 4, 34.25 | 40.50 | 2, 4.50 | 6.00 |
| Mahela Jayawardene | 5, 17.80 | 41.60 | 0, - | - |
Vernon Philander, who had a dream start to his career, picking up 14 wickets in the Australia series, followed it up with 16 wickets in two Tests in Centurion and Cape Town. He especially tormented Sangakkara and Angelo Mathews, dismissing them two and three times respectively while conceding just 13 and six runs in the process. Dilshan and Jayawardene were dismissed twice each by Steyn and averaged less than 20 against him. Rudolph, who moved down the order in the third Test after a string of failures, was nailed on three occasions by Thisara Perera. Chanaka Welegedara, who finished with his best bowling figures of 5 for 52 in Durban, troubled Kallis with the ball going across the right-hander and claimed his wicket twice, conceding just 46 runs.
| Batsman | Bowler | Dismissals | Average | Balls/dismissal |
| Angelo Mathews | Vernon Philander | 3 | 4.33 | 15.66 |
| Dinesh Chandimal | Morne Morkel | 2 | 5.50 | 18.00 |
| Tillakaratne Dilshan | Dale Steyn | 2 | 18.50 | 17.50 |
| Mahela Jayawardene | Dale Steyn | 2 | 12.50 | 28.50 |
| Kumar Sangakkara | Vernon Philander | 2 | 3.00 | 9.50 |
| Jacques Rudolph | Thissara Perera | 3 | 11.66 | 17.66 |
| Jacques Kallis | Chanaka Welegedara | 2 | 23.00 | 47.50 |
| Graeme Smith | Dilhara Fernando | 2 | 8.00 | 18.00 |
Steyn, during the course of the series, became the second-fastest bowler to reach the 250-wicket mark in Test cricket (49 Tests). His extraordinary strike-rate of 40.0 is easily the best among all bowlers with 200-plus wickets. However, in this series, Steyn ended up wicketless in two completed innings, in Durban and Cape Town. While this has happened six times in his career, these are the only occasions when he has bowled over 20 overs in a home Test innings without success.
Since the start of 2010, Steyn has bowled exceptionally to right-hand batsmen in the first innings. With his stock delivery being the ball that swings away from the right-hander, he has a stunning average (15.78) and strike rate (30.14) against them. In contrast, he has had his issues with left-handers, averaging a comparatively higher 22.38 at a strike-rate of 47.07. In the second innings, however, Steyn has an average of 29.41 since the start of 2010. This high average is predominantly due to his ordinary figures in the fourth innings, in which he has just eight wickets at 50.25. Against both right and left-hand batsmen, he has been unable to have the same impact as in the first innings. While his average and strike-rate against right-handers are 28.72 and 49.63, the corresponding figures against left-handers are even worse (31.11 and 59.11).
| Type of batsman | Team innings | Wickets | Average | Economy | Strike rate |
| Right-hand batsman | 1 | 47 | 15.78 | 3.14 | 30.14 |
| Left-hand batsman | 1 | 13 | 22.38 | 2.85 | 47.07 |
| Right-hand batsman | 2 | 22 | 28.72 | 3.47 | 49.63 |
| Left-hand batsman | 2 | 9 | 31.11 | 3.15 | 59.11 |