Can Trott solve England's No.3 headache?
Over the last four decades, England's No.3 has been the poorest among the top sides. Jonathan Trott has the opportunity to put an end to that trend
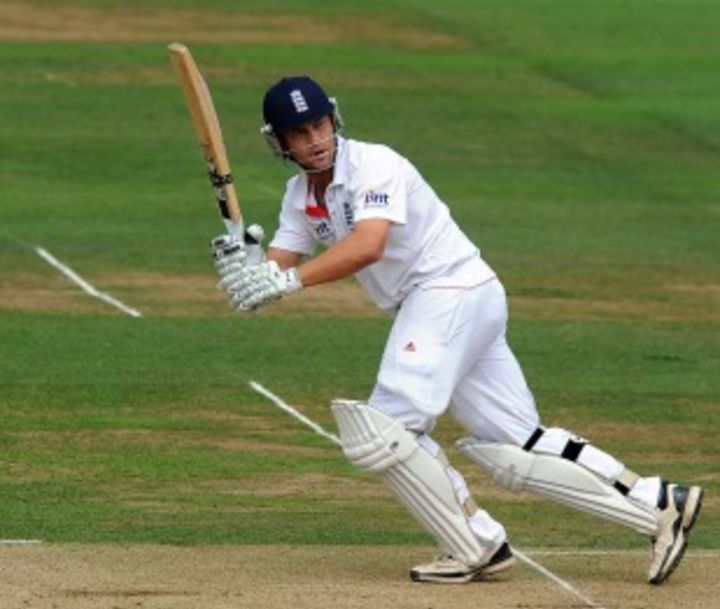
In his latest Different Strokes blog, Mike Holmans made a case for Jonathan Trott as England's long-term No.3 batsman. Trott has certainly looked the part in his brief international career so far, averaging 55 in 13 Tests, and almost 54 in the 17 innings when he has batted at No.3.
Admittedly, these are early days for Trott and a deeper assessment can be made only after he faces tougher challenges: his highest Test score of 226 has come against Bangladesh, while in seven innings in South Africa he scored 190. How he fares in Australia later this year will probably shape his short-term future, but if he cements his place at that slot all of England will heave a sigh of relief, for the No.3 position has given England plenty of headaches for a long time.
Over the last four decades, the combined average of England's No.3 batsmen is lower than the corresponding averages for all teams except Zimbabwe and Bangladesh. England have also used as many as 70 different batsmen at that slot in the 445 Tests they have played - an average of less than six-and-a-half Tests per player. On the other hand, Australia, who are on top of the averages chart, have used only 45 batsmen in 409 Tests - an average of more than nine matches per player. India, who are second in terms of averages, have used 43 players in 324 games.
What's also surprising is the difference in averages between England and the top two teams in the list: Australia's average is 33% better than England, while for India the corresponding percentage is almost 29%. Even New Zealand, which has traditionally been a relatively weak batting team, have a higher average, thanks to the likes of Stephen Fleming, Andrew Jones and Bevan Congdon.
| Team | No. of batsmen | Tests | Runs | Average | 100s/ 50s |
| Australia | 45 | 409 | 31,132 | 46.05 | 88/ 141 |
| India | 43 | 324 | 22,813 | 44.64 | 58/ 107 |
| West Indies | 52 | 337 | 23,721 | 43.44 | 67/ 102 |
| Sri Lanka | 29 | 195 | 13,548 | 43.14 | 35/ 57 |
| South Africa | 24 | 185 | 12,362 | 42.62 | 30/ 62 |
| New Zealand | 47 | 264 | 16,061 | 36.66 | 37/ 65 |
| Pakistan | 53 | 293 | 17,059 | 36.21 | 37/ 74 |
| England | 70 | 445 | 26,304 | 34.70 | 57/ 132 |
| Zimbabwe | 15 | 83 | 4227 | 28.75 | 5/ 26 |
| Bangladesh | 14 | 68 | 3766 | 28.31 | 4/ 27 |
The list of top ten batsmen at No.3 in these last 40 years is dominated by West Indians, with two of them - Viv Richards and Brian Lara - taking the top two spots. Of the 8540 runs Richards scored in Tests, 41% came at the No.3 slot, as did half of his centuries. Richards was clearly at his best at No.3: at Nos. 4 and 5, the only other positions where he aggregated more than 1000 runs, he averaged less than 50. (Click here for Richards' career summary.) Lara scored most of his runs at four, but he was more prolific at No.3, averaging 60.46 at this position, and 51.25 at two-down. Sri Lanka's Kumar Sangakkara is the only other batsman with a 60-plus average.
Ricky Ponting and Rahul Dravid, the two highest run-getters at this position, follow Sangakkara - both batsmen have scored more than 75% of their Test runs at No.3. England's only representative in the top ten is David Gower, who averaged almost 50 at one-down. Like Lara, Gower too scored more runs at No.4, but he averaged only 38.36 at that position.
| Batsman | Tests | Runs | Average | 100s/ 50s |
| Viv Richards | 45 | 3508 | 61.54 | 12/ 14 |
| Brian Lara | 45 | 3749 | 60.46 | 9/ 13 |
| Kumar Sangakkara | 84 | 7383 | 60.02 | 22/ 31 |
| Ricky Ponting | 105 | 9519 | 58.75 | 32/ 39 |
| Rahul Dravid | 116 | 9065 | 54.60 | 23/ 45 |
| Younis Khan | 47 | 3913 | 50.81 | 12/ 12 |
| Ian Chappell | 41 | 3352 | 50.78 | 10/ 18 |
| Hashim Amla | 42 | 3099 | 49.98 | 9/ 16 |
| Jacques Kallis | 49 | 3335 | 49.77 | 9/ 16 |
| David Gower | 35 | 2619 | 49.41 | 8/ 10 |
In the table above, six out of ten batsmen played predominantly in the 2000s, which shows how good this decade was for No.3 batsmen. In the 1990s, they averaged 35.99, which is the lowest in the last four decades; in the next ten years and a bit (including the Tests played in 2010 so far), the average has gone up to 43.44, an increase of 20.7%. Obviously, the 2000s has overall been an excellent decade for batsmen, but the No.3 batsmen have had an above-average contribution to it: whereas the overall batting average has increased by less than nine percent, for the No.3s it's gone up by more than twice that number.
| Decade | Tests | Runs | Average | 100s/ 50s | Overall decade ave |
| 1970s | 198 | 27,116 | 40.17 | 72/ 133 | 30.76 |
| 1980s | 266 | 32,177 | 38.07 | 75/ 155 | 30.45 |
| 1990s | 347 | 40,857 | 35.99 | 89/ 192 | 29.45 |
| 2000 onwards | 491 | 70,866 | 43.44 | 182/ 313 | 32.08 |
Coming back to England, what also stands out is the number of runs that their No.3s have scored. All teams except New Zealand and England have had at least one batsman who has scored more than 3000 runs at that slot in these 40 years. New Zealand's highest is Fleming's 2977 runs at 47.25, while for England the highest aggregate belongs to Mark Butcher. He scored 2796 runs, but at an ordinary average of 38.30, with only six centuries in 78 innings.
Apart from Gower, the only England No.3 batsman who scored more than 2000 runs at a 40-plus average was Nasser Hussain, who averaged 40.55 for his 2352 runs. Alec Stewart, Michael Vaughan and Mike Gatting all averaged on the right side of 40, but they all scored less than 1500 runs at that position. Ian Bell was thought to have the ideal technique for a No.3 batsman, but he has been an utter disappointment, with a highest of 92 and an average of 31.43 in 33 innings.
With such a mediocre recent history, it's hardly surprising that so much hope has been pinned on Trott, who has the highest average among England's one-down batsmen who've scored at least 750 runs in the last 40 years. If he can keep that top spot at the end of the Ashes series, England will feel they've found their long-term No.3.
| Batsman | Tests | Runs | Average | 100s/ 50s |
| Jonathan Trott | 11 | 807 | 53.80 | 2/ 2 |
| David Gower | 35 | 2619 | 49.41 | 8/ 10 |
| Alec Stewart | 20 | 1307 | 43.56 | 3/ 5 |
| Nasser Hussain | 40 | 2352 | 40.55 | 6/ 13 |
| Michael Vaughan | 24 | 1494 | 40.37 | 6/ 2 |
| Mike Gatting | 21 | 1372 | 40.35 | 4/ 6 |
| John Edrich | 16 | 911 | 39.60 | 1/ 7 |
| Mark Butcher | 45 | 2796 | 38.30 | 6/ 17 |
| Chris Tavare | 12 | 771 | 36.71 | 1/ 5 |
| Derek Randall | 14 | 768 | 34.90 | 2/ 4 |
S Rajesh is stats editor of Cricinfo
Read in App
Elevate your reading experience on ESPNcricinfo App.