Kolkata's solid starts, and Pune's surprise bowling star
The benefits of slow and steady starts in IPL 2011, and two of the most stingy bowlers in the tournament so far
S Rajesh
06-May-2011
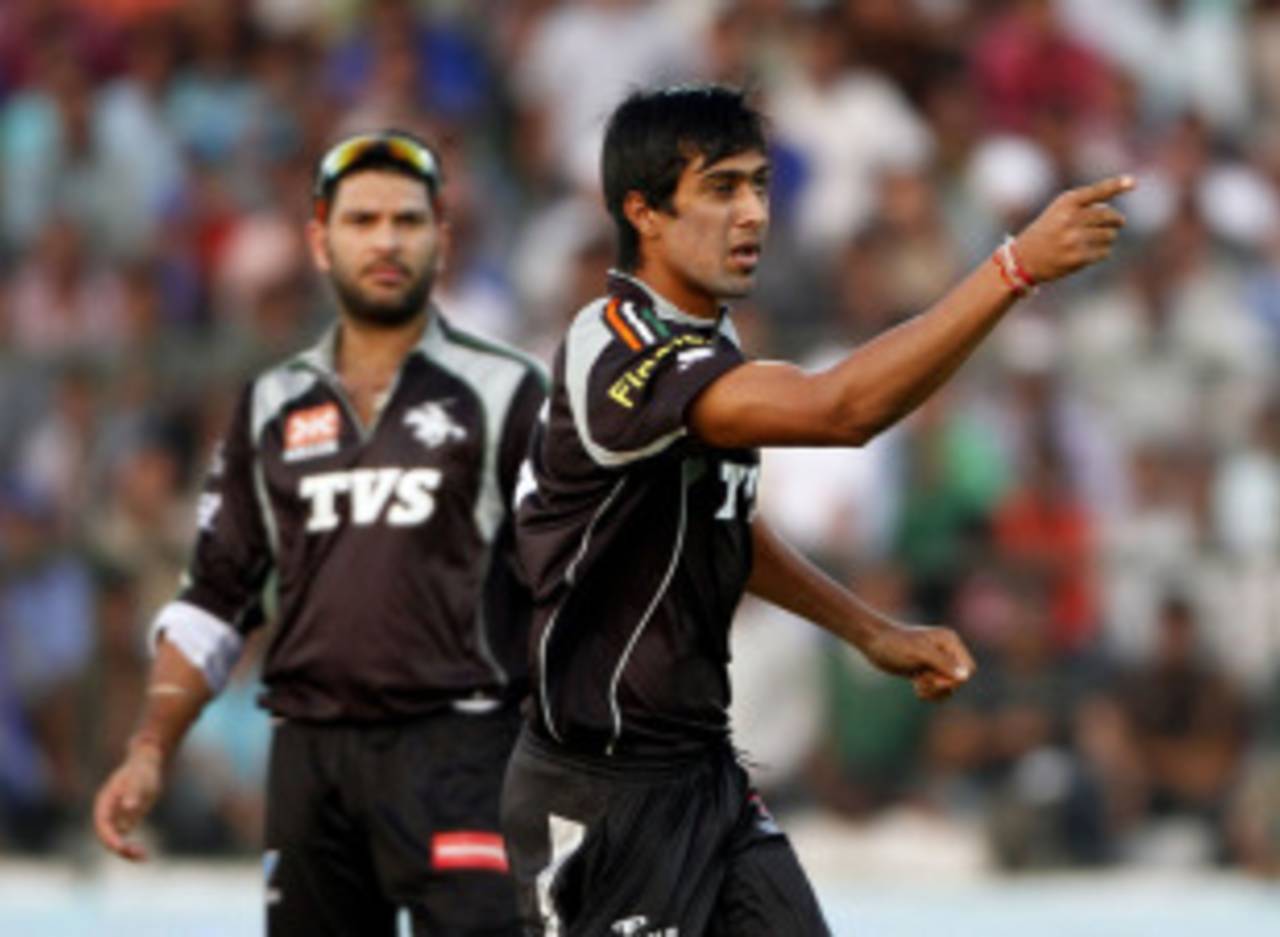
Rahul Sharma had an economy rate of 8.08 in IPL 2010; this season, it has improved dramatically to 5.27 • Associated Press
To say that a good start is vitally important in 20-over cricket is to state the obvious. In a format which gives the batting team only 120 deliveries, it's usually more difficult for the team to come back from a poor beginning, because there are fewer deliveries to resurrect an innings.
In this IPL so far, though, the teams that are doing the best are those that are losing the fewest wickets in the first six overs, even if in the process the teams score relatively few runs during this period. Mumbai, Kolkata, Rajasthan and Chennai are the top four in IPL 2011 after 46 matches, those are the only four teams to average more than 35 runs per wicket in the first six. What's more surprising, though, is the fact that Rajasthan, Chennai and Mumbai are also the three teams with the lowest run-rates in the Powerplay overs - Rajasthan's average six-over score has been 37 for 1, while Chennai's and Mumbai's are 40 for 1. Clearly, they've allowed their top-order batsmen more deliveries to get their eye in, believing it will pay off in the latter part of their innings. Going by the results so far, it's been a strategy that has worked.
On the other hand, the team at the bottom of the points table is also the one with the poorest average in the first six: Pune Warriors have lost 18 wickets in nine matches, which is an average of two per game, and average barely over 22. The other new franchise, Kochi Tuskers Kerala, have done better in the tournament so far, but they've also struggled at the top of the order, losing more wickets in the first six than any other side.
The team with the highest run-rate in the first six is Kings XI Punjab: their opening combination of Adam Gilchrist and Paul Valthaty have flayed bowling attacks, but their own bowling line-ups have been pretty generous to opposition batsmen.
| Team | Runs | Balls | Wickets | Average | Run rate |
| Kolkata Knight Riders | 444 | 360 | 10 | 44.40 | 7.40 |
| Chennai Super Kings | 357 | 324 | 9 | 39.67 | 6.61 |
| Rajasthan Royals | 337 | 324 | 9 | 37.44 | 6.24 |
| Mumbai Indians | 359 | 324 | 10 | 35.90 | 6.64 |
| Kings XI Punjab | 350 | 251 | 11 | 31.81 | 8.36 |
| Royal Challengers Bangalore | 312 | 252 | 11 | 28.36 | 7.42 |
| Deccan Chargers | 415 | 360 | 15 | 27.66 | 6.91 |
| Delhi Daredevils | 431 | 360 | 17 | 25.35 | 7.18 |
| Kochi Tuskers Kerala | 442 | 360 | 19 | 23.26 | 7.36 |
| Pune Warriors | 383 | 324 | 18 | 21.27 | 7.09 |
The batsman who has scored the most runs in the first six is Virender Sehwag, with 188 runs off just 128 balls. Delhi's overall numbers, though, are spoiled by David Warner, Naman Ojha and Aaron Finch, who've been dismissed 11 times for a combined total of 185 runs.
For the top teams, more than one batsman has done well in the first six. Sachin Tendulkar and Ambati Rayudu (69 runs, zero dismissals) have been the stars for Mumbai, Michael Hussey and Murali Vijay have done the job pretty well for Chennai, while Rahul Dravid and Shane Watson have handled the responsibility for Rajasthan. Kolkata's highest scorer has been Jacques Kallis, but Gautam Gambhir (75 runs, one dismissal) has also contributed handily.
| Batsman | Balls | Runs | Dismissals | Average | Runs per over |
| Virender Sehwag | 128 | 188 | 3 | 62.67 | 8.81 |
| Jacques Kallis | 143 | 165 | 4 | 41.25 | 6.92 |
| Jesse Ryder | 107 | 165 | 6 | 27.50 | 9.25 |
| Brendon McCullum | 116 | 152 | 5 | 30.40 | 7.86 |
| Paul Valthaty | 105 | 149 | 3 | 49.67 | 8.51 |
| Shikhar Dhawan | 120 | 144 | 5 | 28.80 | 7.20 |
| David Warner | 124 | 136 | 5 | 27.20 | 6.58 |
| Sachin Tendulkar | 129 | 134 | 2 | 67.00 | 6.23 |
| Rahul Dravid | 135 | 127 | 2 | 63.50 | 5.64 |
| Sunny Sohal | 98 | 127 | 3 | 42.33 | 7.77 |
| Murali Vijay | 118 | 127 | 4 | 31.75 | 6.45 |
| Adam Gilchrist | 95 | 112 | 4 | 28.00 | 7.07 |
| Michael Hussey | 111 | 110 | 2 | 55.00 | 5.94 |
Misers with the ball
Forty-six games into the IPL, the bowler with the best economy rate (with a cut-off of 20 overs) isn't Lasith Malinga, or Daniel Vettori, or Shane Warne; it's little-known Rahul Sharma, a legspinner from Punjab who has been pretty much the lone shining light for the beleaguered Pune Warriors. He doesn't turn the ball much, but his ability to extract bounce and pace off the track and his unerring accuracy have made him the toughest bowler to get away this season. In 33 overs so far, Rahul Sharma has an outstanding economy rate of 5.27, which is significantly better than the next-best, Vettori's 5.82. Against Mumbai - the best team of the tournament - he returned figures of 2 for 7 from four overs, which are the most economical figures of this IPL, and the third-best four-over spell in all IPLs. The two more economical ones - six runs in four overs by Fidel Edwards and Ashish Nehra - were both in the 2009 IPL in South Africa, which means Rahul's spell is the most economical four-over spell in any IPL game in India.
Forty-six games into the IPL, the bowler with the best economy rate (with a cut-off of 20 overs) isn't Lasith Malinga, or Daniel Vettori, or Shane Warne; it's little-known Rahul Sharma, a legspinner from Punjab who has been pretty much the lone shining light for the beleaguered Pune Warriors. He doesn't turn the ball much, but his ability to extract bounce and pace off the track and his unerring accuracy have made him the toughest bowler to get away this season. In 33 overs so far, Rahul Sharma has an outstanding economy rate of 5.27, which is significantly better than the next-best, Vettori's 5.82. Against Mumbai - the best team of the tournament - he returned figures of 2 for 7 from four overs, which are the most economical figures of this IPL, and the third-best four-over spell in all IPLs. The two more economical ones - six runs in four overs by Fidel Edwards and Ashish Nehra - were both in the 2009 IPL in South Africa, which means Rahul's spell is the most economical four-over spell in any IPL game in India.
What makes his performances so far even more special is the fact that he has managed to maintain his high levels despite so much mediocrity all around him: his team has lost seven games in a row in this IPL, but in those seven matches, Rahul has taken ten wickets at an average of 14.40 and an economy rate of 5.33. Clearly, Pune can't blame him for the situation they find themselves in.
| Bowler | Overs | Runs | Wickets | Average | Econ rate |
| Rahul Sharma | 33 | 174 | 11 | 15.81 | 5.27 |
| Daniel Vettori | 28 | 163 | 4 | 40.75 | 5.82 |
| Lasith Malinga | 35.4 | 208 | 22 | 9.45 | 5.83 |
| Ali Murtaza | 20 | 117 | 3 | 39.00 | 5.85 |
| Yusuf Pathan | 28 | 165 | 10 | 16.50 | 5.89 |
| Shane Warne | 35 | 207 | 11 | 18.81 | 5.91 |
Rahul had played the IPL in 2010 too, but achieved nowhere near the kind of success he has this year: in six matches for Deccan Chargers, Rahul only managed five wickets and an economy rate of more than eight runs per over. This year he has been a revelation, and his consistency is untouched - only once in nine matches has his economy rate gone past seven, while three times he has bowled his whole quota of overs and conceded under 20 runs.
A look at his domestic numbers indicate Rahul came into this tournament with some good performances in recent games: in the Vijay Hazare Trophy, the domestic one-day tournament held earlier this year, he was the fifth-highest wicket-taker, and averaged less than 19 per wicket. Even so, few would have expected him to be the most difficult bowler to score runs off in IPl 2011. If he continues in a similar vein through the rest of the tournament, he may well find himself being in contention for a place in the Indian team in the limited-over formats.
| Season | Balls | Runs | Wickets | Average | Econ rate | 4s/ 6s conceded |
| 2010 | 124 | 167 | 5 | 33.40 | 8.08 | 8/ 11 |
| 2011 | 198 | 174 | 11 | 15.81 | 5.27 | 10/ 4 |
Meanwhile, in the last six overs, the star has been Chennai's Doug Bollinger: his economy rate of 5.72 is the best among bowlers who've bowled at least 50 balls. Bollinger is also one of only three bowlers to concede less than a run a ball during these overs - the others are Lasith Malinga, who you'd expect to feature in this list, and the impressive Rahul Sharma.
| Bowler | Balls | Runs | Dismissals | Average | Econ rate | 4s/ 6s conceded |
| Doug Bollinger | 66 | 63 | 5 | 12.60 | 5.72 | 2/ 2 |
| Lasith Malinga | 82 | 79 | 12 | 6.58 | 5.78 | 7/ 2 |
| Rahul Sharma | 72 | 70 | 5 | 14.00 | 5.83 | 5/ 2 |
| Harbhajan Singh | 54 | 57 | 6 | 9.50 | 6.33 | 6/ 0 |
| Ravindra Jadeja | 54 | 66 | 1 | 66.00 | 7.33 | 2/ 3 |
| RP Singh | 54 | 70 | 2 | 35.00 | 7.77 | 8/ 0 |
A comparison of Bollinger's stats in the previous IPL and in this one reveals some interesting numbers. His overall economy rate and average aren't much different this year from what they were in 2010, but Bollinger has become far more dangerous in the last six overs in IPl 2011. Last year, Bollinger conceded almost nine-and-a-half runs per over in the last six, giving away 113 runs in 72 balls, including seven fours and as many sixes - that's a four or a six every 5.14 deliveries. This year, he has conceded four boundaries - two fours and two sixes - in 66 balls, which is an average of one every 16.50 deliveries. That's a better ratio than even Malinga's (9.11). He is Chennai's best in these overs by quite a margin - the next-best is R Ashwin, with an economy rate of 8.00.
| Year | Overs range | Balls | Runs | Wickets | Average | Econ rate | 4s/ 6s |
| 2010 | 0.1 to 14.0 | 114 | 94 | 6 | 15.67 | 4.94 | 12/ 1 |
| 2011 | 0.1 to 14.0 | 72 | 80 | 5 | 16.00 | 6.67 | 11/ 1 |
| 2010 | 14.1 to 20 | 72 | 113 | 6 | 18.83 | 9.41 | 7/ 7 |
| 2011 | 14.1 to 20 | 66 | 63 | 5 | 12.60 | 5.72 | 2/ 2 |
| 2010 | 0.1 to 20 | 186 | 207 | 12 | 17.25 | 6.67 | 19/ 8 |
| 2011 | 0.1 to 20 | 138 | 143 | 10 | 14.30 | 6.21 | 13/ 3 |
S Rajesh is stats editor of Cricinfo