Performance and result analysis of Test teams
A look at Test teams across the years, measuring the peaks of each team, and the highest peak across teams
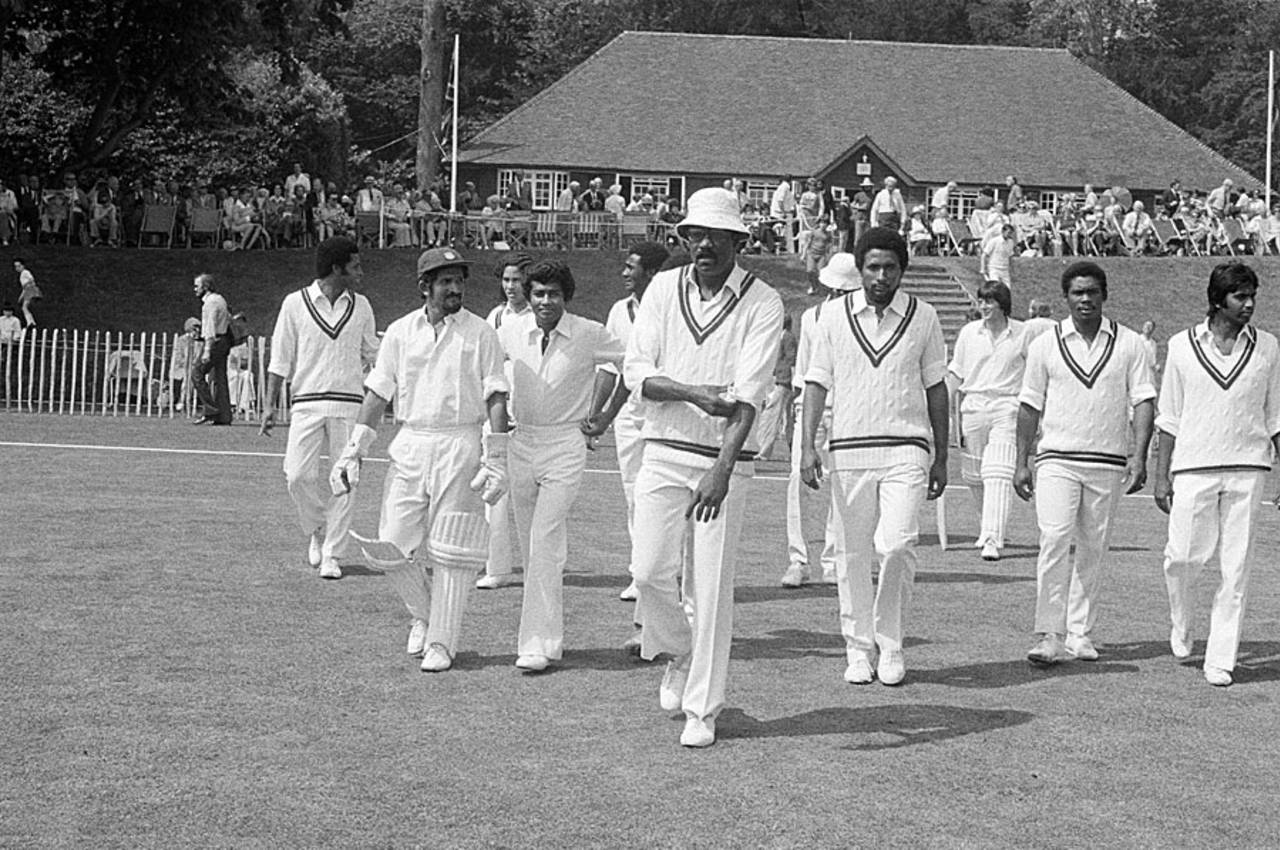
The West Indies team of the 1980s were outstanding, with only Australia's 2000-2006 team bettering them in most aspects • Getty Images
In this follow-up article I will analyse the teams' Performance points and Result points over the many periods. This will let us get a clear handle on the best teams across the years. This is the more important analysis as evidenced by the fact that most of the comments dwelt on the teams, rather than the individuals.
The team performances will be measured through the Team performance index (which is a contribution index developed jointly by Milind and me and was used extensively in the article on Test series) and the Results index, which has been specially developed by me for this article and will be the basis for many a future analysis. The features of the Team performance index is summarised in a Word document, which can be accessed HERE. Since there is a graph embedded in the document, you can download the same and study at leisure.
The Test performance index is the most composite measure reflecting the performance of the team in the match, taking into account every aspect of the match. As such it is an excellent measure of the overall performance of teams. The Result index, on the other hand, is a little more contextual in that the actual result and the match location are considered. However a five-run win is the same as an innings-and-200-runs win. But it is an equally valuable measure. I will do both and present the tables.
Just to give the readers an idea of the Team Performance index, I have given below the Team Performance index values for England and India in the on-going series. India, with their 150-minute non-performance, allowed me to add the Oval Test numbers.
England India
As I did this, I realised that this is not a peer analysis in that the comparisons to the period values do not make any sense. This has to be a direct analysis of the values. These analyses cover all matches up to and including Test #2135, the Harare match between the two African neighbours.
Team Performance Analysis
First let me look at the Test performance index measure since I can straightaway go into the tables. All explanations will be available in the downloadable document.
| Perf Pts | 1877-1914 | 1920-1939 | 1946-1959 | 1960-1969 | 1970-1979 | 1980-1989 | 1990-1999 | 2000-2006 | 2007-2014 | All |
|---|---|---|---|---|---|---|---|---|---|---|
| Australia | 46.16(105) | 52.69(67) | 57.07 (75) | 47.74(67) | 46.47(83) | 44.58(97) | 53.18(108) | 62.62 (84) | 51.88(81) | 51.16 |
| England | 52.24(123) | 47.24(120) | 50.35(115) | 49.50(100) | 48.75(95) | 38.90(104) | 41.12(107) | 48.54(92) | 49.96(95) | 47.45 |
| South Africa | 35.93(40) | 37.20(50) | 42.60(47) | 48.41(31) | 50.00(4)** | 51.01(66) | 51.74(78) | 57.08 (71) | 47.88 | |
| West Indies | 35.86(22) | 50.22(57) | 49.67(49) | 47.96(63) | 55.03 (82) | 46.44(81) | 40.49(82) | 41.32(62) | 46.69 | |
| New Zealand | 29.09(14) | 28.74(38) | 40.32(43) | 37.30(41) | 42.69(59) | 40.52(81) | 45.70(56) | 41.28(62) | 39.80 | |
| India | 31.57(7) | 36.26(57) | 40.32(52) | 43.56(64) | 38.65(81) | 44.68(69) | 47.37(72) | 48.84(80) | 42.95 | |
| Pakistan | 41.46(29) | 36.15(30) | 43.19(46) | 44.27(80) | 46.91(76) | 47.50(66) | 45.70(54) | 44.57 | ||
| Sri Lanka | 34.25(29) | 39.60(67) | 52.05 (71) | 46.70(65) | 44.73 | |||||
| Zimbabwe | 36.82(39) | 33.86(44) | 39.55(11) | 35.75 | ||||||
| Bangladesh | 26.32(44) | 33.28(39) | 29.59 | |||||||
| Total | 47.42 | 44.56 | 46.16 | 45.69 | 45.68 | 43.34 | 45.09 | 47.21 | 47.18 | 45.84 |
The values presented here are the average Team performance points during the specified time period. It is agreed that the specific time periods might not be wholly fair to a particular team. But this is the basis for this analysis. At a later date I will do a more complex floating time period analysis in which we can look at the best period for any team. The period averages vary around 5% either side of the 45 mark. We can draw an overall inference that a higher value, such as the 47 during the 2000-14 period, indicates that more matches have ended in results.
It can be seen that achieving an average of 55.0 is extraordinary and only four teams in history have managed this feat. Australia 1946-59, West Indies 1980-89, Australia 2000-06 and South Africa 2007-14 form the elite group of such teams. Just to put these numbers in perspective, let me take the Australia 2000-06. Their performance index average is 62.62. This is the equivalent of winning all the 84 Test matches they played by 200 runs or six wickets in high-score matches. These comparisons are from actual matches. The average of 55.0 is, incidentally, equivalent to winning all matches by 100 runs or four wickets.
These numbers will stand out when I say that India and Pakistan have never crossed 50.0 in any time period. And Sri Lanka, once, during 2000-06, through that magician extraordinaire, Muralitharan.
Only one team, Australia, has got a performance index average of above 50.0 through the 137 years of Test cricket. Three teams, England, South Africa and West indies, have an average performance index value of 45.0.
Bangladesh have an average index value either side of 30. The lower figure finds matches involving New Zealand either side of the war. But New Zealand have since improved considerably and had their best period during 2000-06 with 45.7.
The custom graph above highlights the aforementioned peaks with distinct coloured dots. The best period for England was the first one, with 52.2. The best for India is the last one, 2007-14, when they averaged 49.17, despite the disastrous away tours. Pakistan was at its best during the 2000-06 period, with an average of 47.50. This period also proved the best for New Zealand, with 47.09 and Sri Lanka, with 52.1. The high values during 2000-06 seem to indicate that teams such as West Indies, Bangladesh and Zimbabwe could have contributed significantly to this upsurge. At least Bangladesh and Zimbabwe are showing signs of a move up. Note also the three dramatic drops after reaching the summit. Let us see whether South Africa, during the coming years, disprove this theory by sustaining their excellence for another period.
Team Results Analysis
This is a fascinating exercise. I started as I normally do intuitively. 2 for a win, 1 for a draw and 0 for a loss. Very simplistic and nowhere near what is required. Then I arbitrarily fixed 2.5 for an away win, 2 for a home win, 1.2 for an away draw and 0.8 for a home draw. But I was quite restless. Something was nagging me. I remembered what Milind was always talking about. Do not use golden numbers without any analytical basis. So I spent quite some time thinking about it.
Out of the 2135 matches, there were 1403 results. These comprised of 836 home wins and 567 away wins. Taking 701 as the mid-point, there was a spread of 42%. That means there was a 13.8% additional chance of a home win. So the home win had to be devalued by this %. Similarly there was 13.8% less chance of an away win. Since this was on a lower number of matches the matches had to be increased in value by 16.2%. The total of points would then come to 2806. The numbers are summarised below.
: 2.0 * 701 / 836 = 1.67703
: 2.0 * 701 / 567 = 2.47266
: 1.67703 * 836 + 2.47266 * 567 = 2806.0 points.
Q.E.D.
Now for the draws. There were 732 draws out of 2135 matches played to date. It was clear to me that the 2 points had to be shared between the two teams and that I had to allocate 1464 points for draws. Unlike wins, there are 732 home draws and 732 away draws here. No playing with these numbers. In what proportion do I allocate? Simple. I assigned for the home draw, 50% of the home win points and for the away draw, the balance of 2.0 and I had the numbers. 0.838515 for the home draw and 1.161485 for the away draw.
: 0.838515*732 + 1.161485*732 = 1464.0 points.
Q.E.D.2.
The only downside, if it can be called that, is that these points are dynamic and change after each Test. The away win values changed after the Harare Test, albeit in the fourth decimal. But that does not matter to me since I do a dynamic calculation each time.
And what about losses? Unlike the Performance analysis, which rewards fighting and competing losses, here I cannot do that. A loss is what it deserves: in this Results analysis, a round zero. Tough luck if it is a one-run loss. This will be no different to a 675-run loss. In the Performance analysis, the one-run loss will fetch 49.91 points and the 675-run loss will fetch 7.2 points.
I am confident that Milind will be proud of this method of determining the weights, although he might have a better method up his sleeve.
| Result Pts | 1877-1914 | 1920-1939 | 1946-1959 | 1960-1969 | 1970-1979 | 1980-1989 | 1990-1999 | 2000-2006 | 2007-2014 | All |
|---|---|---|---|---|---|---|---|---|---|---|
| Australia | 1.00(105) | 1.32(67) | 1.47 (75) | 1.16(67) | 0.99(83) | 0.93(97) | 1.26(108) | 1.66 (84) | 1.18(81) | 1.21 |
| England | 1.21(123) | 1.11(120) | 1.09(115) | 1.16(100) | 1.15(95) | 0.81(104) | 0.83(107) | 1.13(92) | 1.10(95) | 1.07 |
| South Africa | 0.48(40) | 0.73(50) | 0.80(47) | 0.97(31) | 1.25(4)** | 1.22(66) | 1.14(78) | 1.39 (71) | 1.03 | |
| West Indies | 0.61(22) | 1.13(57) | 1.16(49) | 1.06(63) | 1.52 (82) | 1.00(81) | 0.61(82) | 0.70(62) | 1.01 | |
| New Zealand | 0.63(14) | 0.46(38) | 0.75(43) | 0.58(41) | 1.02(59) | 0.81(81) | 0.97(56) | 0.77(62) | 0.79 | |
| India | 0.29(7) | 0.66(57) | 0.69(52) | 0.95(64) | 0.86(81) | 0.93(69) | 1.13(72) | 1.11(80) | 0.91 | |
| Pakistan | 1.00(29) | 0.82(30) | 1.00(46) | 1.08(80) | 1.19(76) | 1.11(66) | 1.04(54) | 1.07 | ||
| Sri Lanka | 0.50(29) | 0.88(67) | 1.05(71) | 1.03(65) | 0.93 | |||||
| Zimbabwe | 0.56(39) | 0.42(44) | 0.46(11) | 0.48 | ||||||
| Bangladesh | 0.13(44) | 0.35(39) | 0.23 | |||||||
| Total | 1.02 | 1.01 | 1.01 | 1.00 | 1.00 | 1.00 | 0.99 | 1.00 | 1.00 | 1.00 |
It is clear that the overall period average will be quite close to 1.0 since all draws lead to two points and only the away matches carry slightly more weight.
The outliers are shown in blue. The same four teams are there, indicating that either of the methods can be used. Australia have averaged 1.66 points during the period 2000-06. Incidentally the average of 1.66 points indicates a home win in every one of their 84 matches, assuming all matches were played at home. West Indies are comfortably in second place, with 1.52 points. This confirms their standing but also clearly separates them from the Australians. Australia in 1946-59 averaged 1.47 and South Africa recently with 1.38 points.
Note how sharply Pakistan have come back into the reckoning on the Results front. Over the years, Pakistan have the best result after Australia, matching England. This clearly shows that they consistently won matches away too. That is the only way to push up the average value.
It has to be conceded that Bangladesh's 0.13 represents a seriously low value, almost certainly indicating the paucity of draws. They have, however, improved to 0.35 recently. And it can be seen that their improvement is sharper than those of Zimbabwe.
The graph highlights the top-placed teams with a red dot. Of the other teams, England started at their best with an average of 1.21 result points. New Zealand's best period was 1980-89 when they crossed 1.0 for the only time in their career. India were good during the past 14 years with a value of 1.13. Pakistan have been quite consistent with most of the values exceeding 1.0 and their best period was the Wasim-Waqar-led 1990s. Sri Lanka crossed 1.0 during the first few years of the 2000s.
Many readers have expressed their views that there should not be any comparisons across periods. But then we will lose out the fun in a big manner. The objective of such comparisons is not to put one team on a pedestal at the expense of the other but to get more insights into how the game has moved on. It will also let us appreciate the achievements of the concerned teams more. These are not Ratings exercises but routes to understanding what different teams achieved despite, or because of, prevailing conditions.
The conclusion has to be made. Australia 2000-06 are ahead of West Indies 1980-89 in almost every table. They had no weakness of any sort. These two are followed by the Australians of 1946-59 and the South Africans of recent vintage.
Bangladesh's results during the first few years have been quite poor. But they are improving, seemingly at a fair rate.
But this is not the last word.
I promise I will do the far more complex analysis of finding the best team over a dynamic 50 Tests/15 series/10 years-max period, using Performance and Result points. That will settle all arguments. I do not promise but may even find a way to build in a team strength component, based on the cumulative Performance/Results points as on date of the concerned Test. Give me a few weeks.
Anantha Narayanan has written for ESPNcricinfo and CastrolCricket and worked with a number of companies on their cricket performance ratings-related systems