A tournament of contrasting venues
In a tournament characterised by vastly different playing surfaces, Mumbai's variety in the bowling attack proved to be crucial
Madhusudhan Ramakrishnan
10-Oct-2011
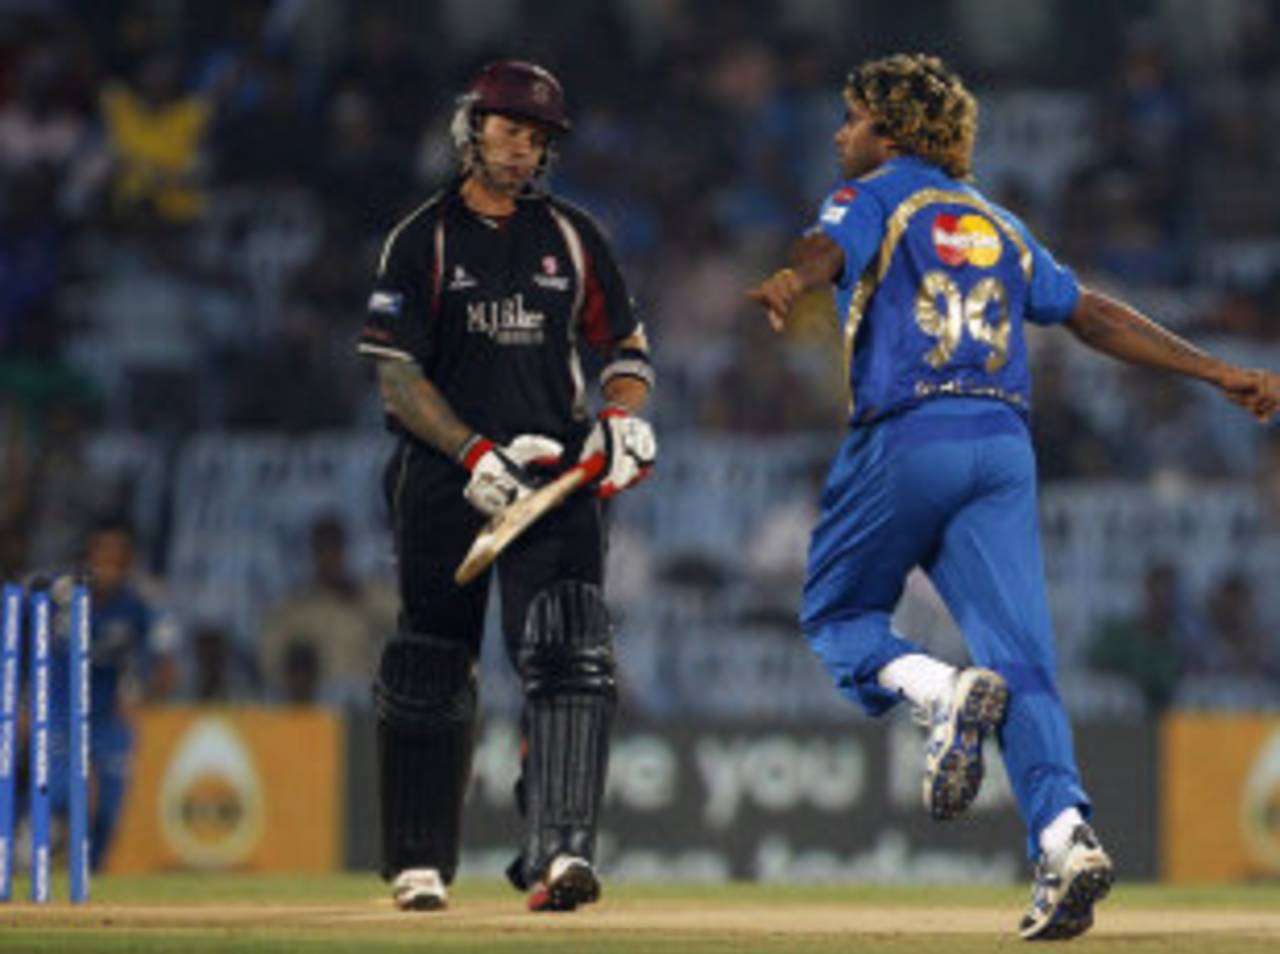
Lasith Malinga finished with ten wickets at an average of 11.70 and economy rate of 5.85 • Associated Press
The overall run-rate in Champions League 2011 was slightly lower than that of the previous season, but that was because of a few low-scoring matches in the qualifying phase, which was introduced for the first time this year. While the average in the matches after the qualifying stage (25.29) was higher than those of the previous two seasons, the run-rate (7.83) was slightly below that of the second season. The boundary-run percentage during the league phase and knock-out matches (53.96) was also higher than the corresponding figures in the previous editions of the Champions League Twenty20. The win-loss ratio for teams batting first in the most recent season (0.85) was also lower than the corresponding ratios for the earlier seasons (1.20).
The tournament overall was a high-scoring one and witnessed 28 scores of 150 and above. While the 2010 tournament has the highest number of such scores (29), the first edition had the lowest number of scores over 150 (16). On the other hand, while the first edition in 2009 had five first-innings scores of below 120, the second and third seasons had only two such scores.
| Year | Innings | Runs | Average | Wickets | Run-rate | Boundary-run % |
| 2011 | 55 | 8222 | 24.39 | 337 | 7.67 | 52.27 |
| 2010 | 46 | 6959 | 25.12 | 277 | 7.95 | 53.85 |
| 2009 | 46 | 6369 | 22.26 | 286 | 7.25 | 53.25 |
The difference in venues
The three venues in the tournament were quite different from each other. Bangalore was by far the best batting track with an overall run-rate of 8.62. The home team Royal Challengers chased over 200 on two occasions including the semi-final against New South Wales. Chennai, however, was not an easy batting pitch. The overall average (21.22) and run-rate (7.09) were much lower than the corresponding figures for the other two venues. The batting difficulties were evident in the final where MI were restricted to 139 but managed to bowl out the Royal Challengers for just 108.
The three venues in the tournament were quite different from each other. Bangalore was by far the best batting track with an overall run-rate of 8.62. The home team Royal Challengers chased over 200 on two occasions including the semi-final against New South Wales. Chennai, however, was not an easy batting pitch. The overall average (21.22) and run-rate (7.09) were much lower than the corresponding figures for the other two venues. The batting difficulties were evident in the final where MI were restricted to 139 but managed to bowl out the Royal Challengers for just 108.
The Rajiv Gandhi Stadium in Hyderabad hosted all the qualifying matches and two of the league games. Teams batting first had the best record in Hyderabad winning six and losing three of the nine matches played. In sharp contrast, chasing proved to be the best option in Bangalore, where teams batting second won on six of the eight occasions (completed matches only). The small size of the boundaries at the Chinnaswamy Stadium in Bangalore also meant that the balls-per-six figure at the venue (14.60) was significantly lower than that of Chennai (37.90) and Hyderabad (30.28).
| Venue | Matches | Wins (batting first) | Wins (chasing) | Average | RR | Balls per six |
| Chennai | 10 | 4 | 5 | 21.22 | 7.09 | 37.90 |
| Bangalore | 10 | 2 | 6 | 29.50 | 8.62 | 14.60 |
| Hyderabad | 9 | 6 | 3 | 23.83 | 7.44 | 30.28 |
Bangalore the best batting surface
In the first-six over period, teams averaged higher and scored at a faster clip in the first innings in Chennai and Hyderabad. The run-rate difference in Hyderabad between the first and second innings is 0.36 and the average difference is 10.80. The pattern is fairly similar in the middle overs (overs 7-14) for these two venues. Teams have done better in the first innings both in terms of the average and run-rate. The story is quite different in case of matches played in Bangalore. Teams batting second have found the going much better in the first six-over period and middle-over period in matches in Bangalore. As seen in the table, they have a higher run-rate and average in the second innings as compared to the first innings. In the final six-over period, however, Chennai is the only venue where teams have done better in the second innings. The boundary-percentage figure is the highest in matches played in Bangalore in the first six-over and the middle-over periods.
In the first-six over period, teams averaged higher and scored at a faster clip in the first innings in Chennai and Hyderabad. The run-rate difference in Hyderabad between the first and second innings is 0.36 and the average difference is 10.80. The pattern is fairly similar in the middle overs (overs 7-14) for these two venues. Teams have done better in the first innings both in terms of the average and run-rate. The story is quite different in case of matches played in Bangalore. Teams batting second have found the going much better in the first six-over period and middle-over period in matches in Bangalore. As seen in the table, they have a higher run-rate and average in the second innings as compared to the first innings. In the final six-over period, however, Chennai is the only venue where teams have done better in the second innings. The boundary-percentage figure is the highest in matches played in Bangalore in the first six-over and the middle-over periods.
| Venue (inns number) | RR, avg (overs 1-6) | Boundary% (overs 1-6) | RR, avg (overs 7-14) | Boundary% (overs 7-14) | RR, avg (overs 15-20) | Boundary% (overs 15-20) |
| Chennai (1st) | 6.81, 31.46 | 59.65 | 6.68, 28.15 | 38.13 | 8.21, 17.00 | 48.27 |
| Bangalore (1st) | 8.42, 37.91 | 71.64 | 7.38, 29.55 | 53.27 | 10.96, 27.60 | 50.43 |
| Hyderabad (1st) | 7.38, 30.69 | 60.15 | 6.55, 42.90 | 51.12 | 9.75, 20.26 | 63.40 |
| Chennai (2nd) | 6.75, 25.31 | 61.23 | 6.02, 17.21 | 34.85 | 8.82, 17.53 | 55.04 |
| Bangalore (2nd) | 8.72, 41.90 | 69.68 | 8.27, 40.66 | 39.40 | 8.60, 14.86 | 50.85 |
| Hyderabad (2nd) | 7.02, 19.89 | 61.90 | 6.68, 20.91 | 35.75 | 7.84, 20.60 | 45.14 |
When the overall stats for the first and second innings for the three venues are considered, there is a marked difference in the numbers. While the boundary percentage is almost the same across innings in Chennai, the run-rate and average are slightly better for teams batting first. Bangalore, by far, has a higher run-rate overall for both innings as compared to the other venues. Despite the excellent record of chasing teams in Bangalore, the stats for the team batting first are better overall. There is no such discrepancy in Hyderabad, however, where teams batting first have the better stats and a better winning record.
| Venue | RR, avg (inns 1) | Boundary% (inns 1) | RR, avg (inns 2) | Boundary% (inns 2) | RR, avg (overall) | Boundary% (overall) |
| Chennai | 7.18, 23.55 | 47.73 | 7.00, 19.18 | 48.10 | 7.09, 21.22 | 47.91 |
| Bangalore | 8.72, 30.78 | 61.59 | 8.51, 28.04 | 59.31 | 8.62, 29.50 | 60.58 |
| Hyderabad | 7.76, 27.96 | 49.64 | 7.12, 20.50 | 46.57 | 7.44, 23.83 | 48.18 |
| Overall | 7.86, 27.16 | 53.22 | 7.47, 21.86 | 51.19 | 7.67, 24.39 | 52.27 |
MI's bowling strength proves vital
MI and Royal Challengers came into the final with vastly different winning strategies. Royal Challengers who had chased down 200-plus targets in two consecutive matches in Bangalore, clearly preferred to bat second while MI, with a varied bowling attack, were inclined to bat first. Royal Challengers, who played all their matches at home, were at a disadvantage in the final as they had to play on a track vastly different from the high-scoring one in Bangalore. In the end, MI demonstrated the importance of a quality bowling attack in the Twenty20 format as they bowled Royal Challengers for 108 with a highly disciplined performance. Royal Challengers, who faltered at the final hurdle, produced one of their better bowling performances in the final. In the previous two matches, they had managed just four wickets while conceding a total of 417 runs.
MI and Royal Challengers came into the final with vastly different winning strategies. Royal Challengers who had chased down 200-plus targets in two consecutive matches in Bangalore, clearly preferred to bat second while MI, with a varied bowling attack, were inclined to bat first. Royal Challengers, who played all their matches at home, were at a disadvantage in the final as they had to play on a track vastly different from the high-scoring one in Bangalore. In the end, MI demonstrated the importance of a quality bowling attack in the Twenty20 format as they bowled Royal Challengers for 108 with a highly disciplined performance. Royal Challengers, who faltered at the final hurdle, produced one of their better bowling performances in the final. In the previous two matches, they had managed just four wickets while conceding a total of 417 runs.
Among the top six teams, New South Wales, who lost to Bangalore in the first semi-final, had the best average difference of 6.70. T&T, who were unlucky to miss out on a semi-final spot, ended the tournament with an excellent bowling numbers (economy rate of 6.17 and bowling average 16.10) but lost out due to their batting, where they averaged just 20.76. Although MI did not have great batting numbers, they made up with superb bowling figures (economy rate of 6.63 and bowling average 17.08). Royal Challengers' weak bowling was severely exploited by opposition teams - they conceded nearly nine runs per over and had the lowest average difference of -13.81. Super Kings, the champions in 2010, had a terrible run finishing bottom of their group with a solitary win and three losses. Their tournament stats were equally bad too - an average difference of -4.24 and run-rate difference of -0.60.
| Team | Wins/losses | Average (batting) | Average (bowling) | RR (batting) | ER (bowling) | Avg diff | RR diff |
| MI | 4/1 | 19.37 | 17.08 | 6.95 | 6.63 | 2.29 | 0.32 |
| Royal Challengers | 3/3 | 23.86 | 37.67 | 9.11 | 8.97 | -13.81 | 0.14 |
| Somerset | 4/2 | 26.67 | 25.43 | 7.57 | 7.84 | 1.24 | -0.27 |
| New South Wales | 2/2 | 31.16 | 24.46 | 8.03 | 7.75 | 6.70 | 0.28 |
| Trinidad & Tobago | 4/1 | 20.76 | 16.10 | 7.05 | 6.17 | 4.66 | 0.88 |
| Knight Riders | 3/3 | 30.71 | 27.45 | 8.07 | 8.03 | 3.26 | 0.04 |
Left-handers edge ahead
David Warner had a stunning tournament in which he scored two consecutive centuries and finished on top of the run-getters list. Warner also scored the most runs in boundaries (228) followed by Chris Gayle, who scored 204 runs in boundaries. The top-order left-handers had a slightly better average than their right-hand counterparts (24.85 to 24.19), and they also ended with a better strike rate (127.64 to 117.23) and higher boundary percentage. Among batsmen who scored a minimum of 100 runs in boundaries, Gayle had the highest percentage of boundary runs (79.37) followed by Daniel Harris (75.36).
David Warner had a stunning tournament in which he scored two consecutive centuries and finished on top of the run-getters list. Warner also scored the most runs in boundaries (228) followed by Chris Gayle, who scored 204 runs in boundaries. The top-order left-handers had a slightly better average than their right-hand counterparts (24.85 to 24.19), and they also ended with a better strike rate (127.64 to 117.23) and higher boundary percentage. Among batsmen who scored a minimum of 100 runs in boundaries, Gayle had the highest percentage of boundary runs (79.37) followed by Daniel Harris (75.36).
| Batsman type | Runs | Average | Strike rate | 100/50 | Boundary% |
| Right-handers | 5251 | 24.19 | 117.23 | 1/24 | 54.23 |
| Left-handers | 2013 | 24.85 | 127.64 | 2/7 | 58.91 |
| Overall | 7264 | 24.37 | 119.94 | 3/31 | 55.53 |
Close contest between pace and spin
Lasith Malinga, who finished as the leading wicket-taker in IPL 2011, ended the Champions League in second position on the wickets table. Ravi Rampaul finished with two more wickets than Malinga, but had a slightly higher average and economy rate. Harbhajan Singh picked up three of his seven wickets in the final including that of Gayle and Virat Kohli, who were both among the top three run-getters in the tournament. Sunil Narine of T&T had extraordinary figures, picking up ten wickets in six innings at an average of 10.50 and an economy rate of just 4.37.
Lasith Malinga, who finished as the leading wicket-taker in IPL 2011, ended the Champions League in second position on the wickets table. Ravi Rampaul finished with two more wickets than Malinga, but had a slightly higher average and economy rate. Harbhajan Singh picked up three of his seven wickets in the final including that of Gayle and Virat Kohli, who were both among the top three run-getters in the tournament. Sunil Narine of T&T had extraordinary figures, picking up ten wickets in six innings at an average of 10.50 and an economy rate of just 4.37.
Pace bowlers had a better average and higher dot-ball percentage than spinners in Chennai, but the spinners' economy rate and boundary-run percentage were considerably lower. In Bangalore, the best batting venue, the spinners once again had the better economy rate and lower boundary-run percentage. Overall, while the pace bowlers finished with a much better average (24.34), the spinners finished with an economy rate of 7.07 as compared to the pace bowlers' 7.80.
| Bowler type | Venue | Wickets/Average | Economy rate | Dot-ball% | Boundary% |
| Pace | Chennai | 77/21.48 | 7.07 | 42.08 | 52.23 |
| Spin | Chennai | 44/23.86 | 6.73 | 38.46 | 43.80 |
| Pace | Bangalore | 58/29.56 | 9.08 | 37.51 | 64.13 |
| Spin | Bangalore | 29/35.17 | 7.69 | 38.23 | 56.86 |
| Pace | Hyderabad | 63/23.03 | 7.42 | 37.45 | 49.89 |
| Spin | Hyderabad | 32/34.28 | 7.07 | 36.55 | 49.77 |
| Pace | Overall | 198/24.34 | 7.80 | 39.22 | 55.76 |
| Spin | Overall | 105/30.16 | 7.14 | 37.73 | 50.07 |