History, spin stand in England's way
England's poor record in India and a persistent weakness against spin bowling mean the hosts will start as favourites
Madhusudhan Ramakrishnan
13-Nov-2012
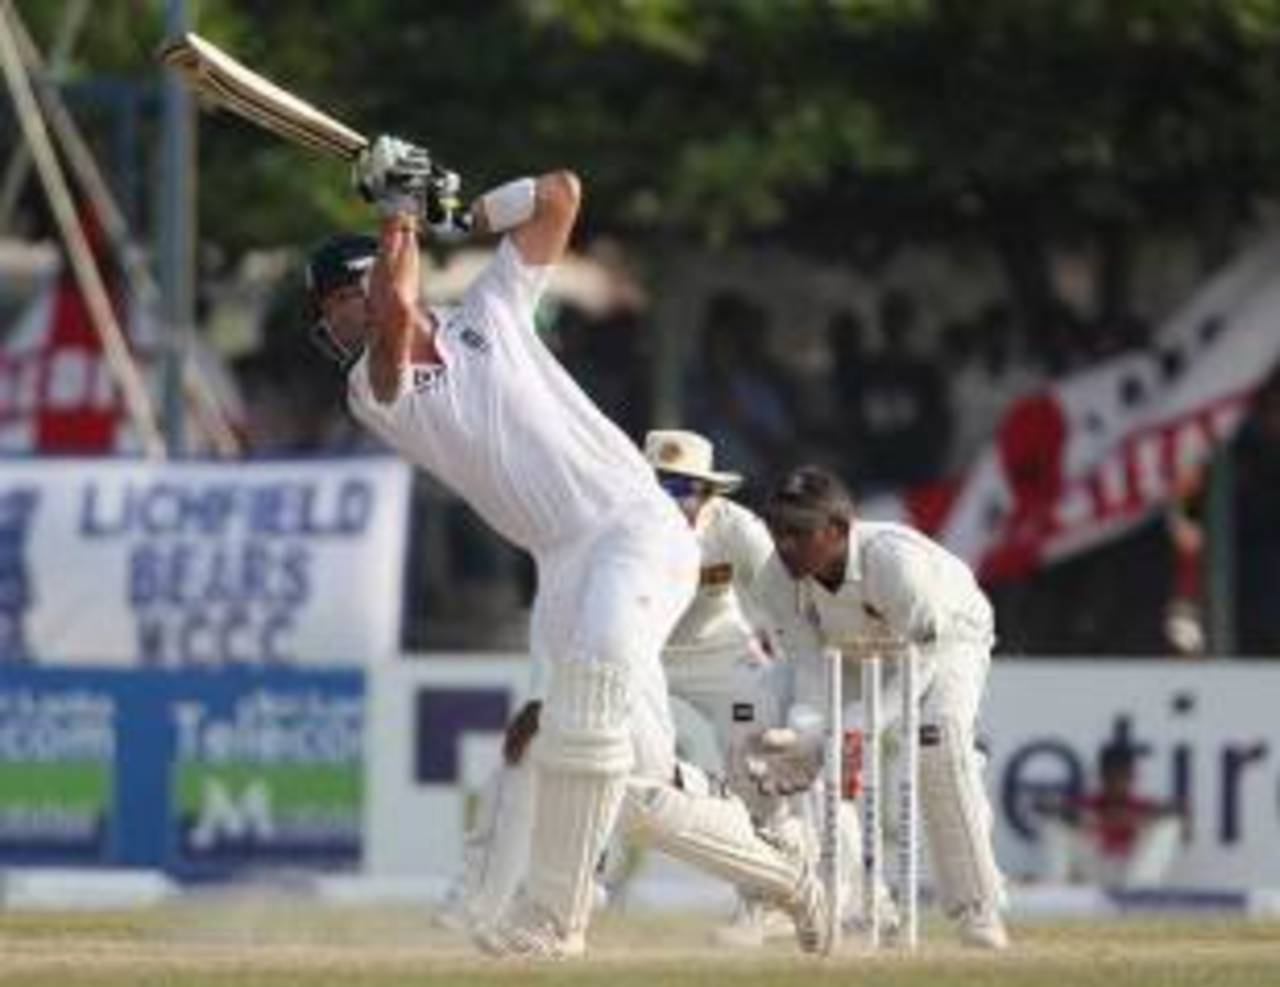
England will rely on Kevin Pietersen's aggressive batting to counter the India spinners • Getty Images
When India began their tour of England last year, they were the No.1 ranked team and expected to provide a stern test to the hosts. Instead, the series turned out to be hopelessly one-sided, with England emerging comfortable winners in all four Tests. India's form plunged further in Australia, where they were again beaten 4-0. In the eight Tests in England and Australia, India lost four by an innings and managed to score over 300 only once. The only successes for India in the period (since July 2011) were home series wins against lower-ranked West Indies and New Zealand. Surprisingly, England also struggled to maintain their position at the top of the rankings, losing 3-0 to Pakistan in the UAE and 2-0 at home to South Africa. Following the retirements of Rahul Dravid and VVS Laxman, India's batsmen will have their task cut out against a top-quality England attack. On the other hand, England's batsmen, who were all at sea against Pakistan's spinners last year, will be challenged in spin-friendly conditions. Given that England have won only one Test in India in their last four visits, the hosts start as favourites going into the first Test in Ahmedabad.
England hold a 38-19 advantage in the head-to-head clashes with India. However, a significant percentage of their matches (46%) have ended in draws. The matches in England have been dominated completely by the hosts, who have won 27 and lost just five Tests. India also hold the edge at home, winning 14 matches to England's 11. Since 1990, India have a 6-1 win-loss record in home Tests with their best performance coming in the 1993 series when they won 3-0. In the same period, India have won two Tests in England (2002 and 2007) and have a win-loss ratio of 0.28. The result percentage in India since 1990 (63.63) is well above the corresponding overall number in India (49.01). In contrast, the result percentage in England in matches since 1990 (52.94) is lower than the overall figure in England (61.53).
| Matches | Wins (India) | Wins (England) | Draws | W/L ratio (India) | Result % | |
| Overall | 103 | 19 | 38 | 46 | 0.50 | 55.33 |
| Since 1990 | 28 | 8 | 8 | 12 | 1.00 | 57.14 |
| Since 2000 | 19 | 5 | 6 | 8 | 0.83 | 61.11 |
| In India | 51 | 14 | 11 | 26 | 1.27 | 49.01 |
| In England | 52 | 5 | 27 | 20 | 0.18 | 61.53 |
| In India (since 1990) | 11 | 6 | 1 | 4 | 6.00 | 63.63 |
| In England (since 1990) | 17 | 2 | 7 | 8 | 0.28 | 52.94 |
Despite their ordinary record in India in the last two decades, England will be quietly confident following their performance in the last two series (one win and two losses). In 2006, they fought back from a match down to square the series in Mumbai. On their last tour (in 2008), England had the better of the Chennai Test till Virender Sehwag's blitz enabled India chase down a challenging target of 387. The average difference for England (difference between batting and bowling averages) in the 2006 series was 2.52 but much lower (-9.86) in 2008. The England batsmen scored more centuries (3) than their Indian counterparts in the drawn 2006 series but were slightly behind on the century tally (3-4) in 2008. In the 1993 series, when England were blanked 3-0, their average difference was -31.23 with India picking up 58 wickets to the visitors' 28. Considering that the wickets difference has drastically fallen in the last two series (six and two respectively), the upcoming series promises to be a far closer contest.
| Series | Series result | England (bat avg) | England (bowl avg) | Avg diff | 100s (Eng/Ind) | Wickets (Eng/Ind) |
| 1993 | 3-0 (India) | 26.05 | 57.28 | -31.23 | 2/4 | 28/58 |
| 2001 | 1-0 (India) | 30.12 | 36.39 | -6.27 | 1/2 | 31/47 |
| 2006 | 1-1 | 33.24 | 30.72 | 2.52 | 3/1 | 46/52 |
| 2008 | 1-0 (India) | 33.10 | 42.96 | -9.86 | 4/3 | 28/30 |
In their last four series, England have won three Tests and lost six including two at home against South Africa. Between the start of 2009 and the series in the UAE, England built up a formidable 20-5 win-loss record. There was, however, a massive difference between their performances in and outside the subcontinent. In matches played in the subcontinent since 2009, England managed only a solitary win against a major Test team (Sri Lanka) and lost four matches. Outside the subcontinent, England have a 20-7 record including a 3-1 Test series win in Australia. England's average difference (difference between batting and bowling averages) is 10.71 in matches outside the subcontinent but falls to 3.15 in matches played in the subcontinent. India, on the other hand, have a tremendous win-loss record in the subcontinent (13-2) but an ordinary one (3-9) outside the subcontinent. The team record is clearly reflected in the average difference; in the subcontinent, the average difference for India is 12.11 while the corresponding number outside the subcontinent is -11.17. On average, England have been a more penetrative bowling unit as the wickets-per-match figure suggests. England, who have a win-loss ratio of 2.09, have a marginally better ratio of 100s to 50s as compared to India (0.47 to 0.44).
| Eng (wins/losses) | Ind (wins/losses) | Eng (bat avg/bowl avg) | Ind (bat avg/bowl avg) | Eng (100/50) | Ind (100/50) | Eng (wkts/Test) | Ind (wkts/Test) | |
| Overall | 23/11 | 16/11 | 40.46/31.17 | 38.14/37.81 | 55/116 | 48/108 | 16.65 | 15.62 |
| Subcontinent | 3/4 | 13/2 | 31.64/28.49 | 47.71/35.60 | 6/15 | 37/59 | 18.57 | 16.85 |
| Outside subcontinent | 20/7 | 3/9 | 42.41/31.70 | 29.73/40.90 | 49/101 | 11/49 | 16.32 | 14.17 |
Alastair Cook, England's highest run-getter since 2009, has an average of 43.34 against fast bowlers in Tests outside the subcontinent. The number increases to 67.33 in matches played in the subcontinent. Spinners have found it difficult to dislodge Cook in matches outside Asia (balls per dismissal 168.83) but have done significantly better in matches played in the subcontinent. Jonathan Trott has fairly even numbers against pace bowlers in and outside the subcontinent but has fallen far more often to spinners in matches played in the subcontinent (average 33.55). Kevin Pietersen, who is back in the England squad after a stormy period, has a lower average but high scoring rate (3.78) owing to his aggressive approach. Pietersen's quickfire century at the P Sara Oval last year set up England's eight-wicket win and he will once again be England's trump card in a series that is likely to be decided by how the visitors fare against the Indian spinners. Ian Bell, who has been supremely consistent in matches outside the subcontinent, has failed to replicate the form against pace and spin in the subcontinent (27.00 and 39.00 respectively).
India's batting woes have been primarily because of the ordinary run at the top of the order. In Tests since the start of 2011, the Virender Sehwag-Gautam Gambhir partnership has averaged just 30.25, with both batsmen failing to register a single century. If the openers don't fire, the inexperienced middle order will mount pressure on Sachin Tendulkar and the in-form Virat Kohli to deliver. On the other hand, England's middle and lower order batting looks in considerably better shape with Stuart Broad and Graeme Swann coming in after Matt Prior, who averages 43.17 in Tests since 2009.
| Outside subcontinent - pace | Outside subcontinent - spin |
Subcontinent - pace | Subcontinent - spin | |
| Alastair Cook | 43.34, 87.42 | 81.58, 168.83 | 67.33, 148.00 | 50.44, 108.88 |
| Jonathan Trott | 43.40, 87.68 | 222.33, 468.33 | 47.00, 79.25 | 33.55, 92.77 |
| Kevin Pietersen | 51.44, 86.23 | 52.18, 80.63 | 48.00, 88.50 | 44.70, 61.20 |
| Ian Bell | 45.39. 89.63 | 102.88, 193.11 | 27.00, 48.66 | 39.00, 76.37 |
James Anderson, who passed the 250-wicket mark in the series in Sri Lanka, has an excellent record against Tendulkar, whom he has dismissed seven times in matches played since 2005. Sehwag has scored at over eight runs per over off Anderson but has been dismissed four times in 40 deliveries. Graeme Swann, who has generally been successful against left-handers, has dismissed Gambhir five times at an average of 20.60. Stuart Broad, the highest wicket-taker in the England-India series in 2011, has enjoyed much success against MS Dhoni, dismissing the Indian captain three times while conceding just 28 runs.
Zaheer Khan, who hobbled off after picking up two wickets in the first Test at Lord's last year, has hardly proved to be incisive ever since. In the two-Test series against New Zealand, Zaheer picked up just three wickets at an average of close to 60. He, however, has a strong record against Bell and Cook, dismissing them five and four times respectively. Bell, in particular, has struggled against Zaheer, scoring just 18 runs at an average of 3.60. Ishant Sharma, who is not a certainty for the first Test, has had the better of his contests with Cook, dismissing the England captain six times at an average of 16.66.
| Batsman | Bowler | Dismissals | Average | Balls per dismissal | Scoring rate |
| Sachin Tendulkar | James Anderson | 7 | 26.28 | 45.28 | 3.48 |
| Gautam Gambhir | Graeme Swann | 5 | 20.60 | 44.40 | 2.78 |
| Virender Sehwag | James Anderson | 4 | 13.50 | 10.00 | 8.10 |
| MS Dhoni | Stuart Broad | 3 | 9.33 | 29.00 | 1.93 |
| Alastair Cook | Ishant Sharma | 6 | 16.66 | 40.83 | 2.44 |
| Ian Bell | Zaheer Khan | 5 | 3.60 | 6.80 | 3.17 |
| Alastair Cook | Zaheer Khan | 4 | 30.00 | 46.25 | 3.89 |
Ahmedabad, the venue for the first Test, has hosted three Tests since 2006. While two of them have been high-scoring draws, the game against South Africa ended in a victory for the visitors after India were bowled out for 76 in their first innings. Mumbai has hosted only two Tests in the same period, with England winning the game in 2006 and the second (against West Indies) ending in a draw with the scores level. Nagpur, which is set to host the final Test, is the only venue among the four that has a 100% result record. While Ahmedabad has the lowest first-innings average (32.96), it has the highest second-innings average (71.37) among the four venues. While the third and fourth-innings averages in Mumbai are 16.25 and 18.00 respectively, the corresponding numbers in Nagpur are 26.13 and 20.90. Spinners have picked up more wickets than pace bowlers at all three venues except Ahmedabad. At Mumbai, both pace bowlers and spinners have performed well (average 32.16 and 29.77). In contrast, the corresponding numbers in Kolkata are 59.90 and 46.59.
| Venue | Matches | Result% | Avg (1st inns/2nd inns) | Avg (3rd inns/4th inns) | Pace (wkts/avg) | Spin (wkts/avg) |
| Ahmedabad | 3 | 33.33 | 32.96/71.37 | 41.91/22.00 | 45/36.77 | 33/59.03 |
| Mumbai | 2 | 50.00 | 49.50/41.03 | 16.25/18.00 | 36/32.16 | 40/29.77 |
| Kolkata | 3 | 66.67 | 70.13/48.15 | 38.83/53.50 | 31/59.90 | 42/46.59 |
| Nagpur | 3 | 100.00 | 45.84/41.03 | 26.13/20.90 | 44/32.79 | 46/38.28 |
Madhusudhan Ramakrishnan is a sub-editor (stats) at ESPNcricinfo