Are the last five overs more productive in this World T20?
A look at the scoring patterns in this tournament, and a comparison with previous editions of the World Twenty20
S Rajesh
04-Apr-2014
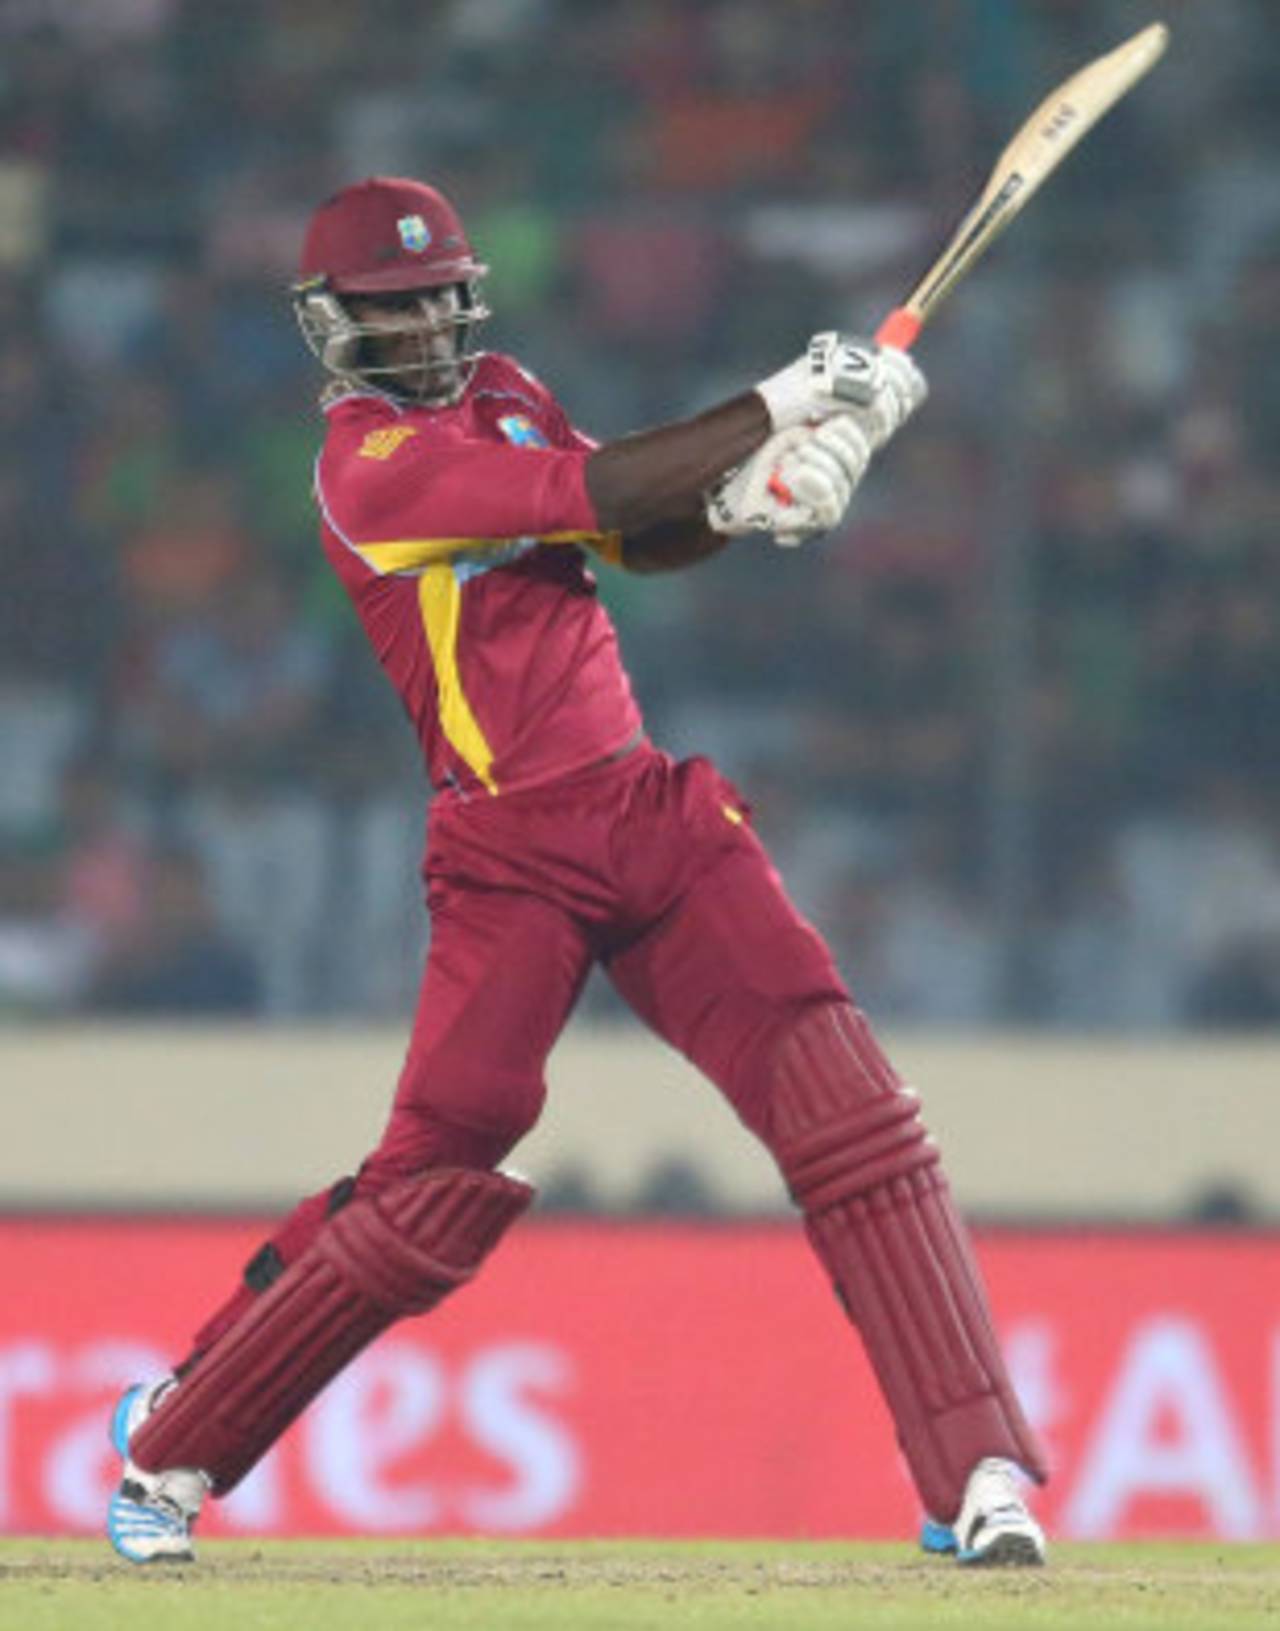
Darren Sammy has been the most prominent example of a batsman who has squeezed out every last bit from the last five overs • Getty Images
This is the fifth edition of the World Twenty20, and over the years teams have evolved strategies with both bat and ball to optimise their resources in a crunched 20-over format. Batsmen have tried to use the Powerplay overs differently, and have realised the value of keeping wickets in hand even in this format where only 120 balls are available; bowling teams have increasingly realised the value of slow bowlers - even with the new ball - and of taking pace off the ball.
Despite all the changes, though, the overall numbers in the five World T20s have remained remarkably similar, even though the tournament has been hosted in different countries - South Africa, England, West Indies, and then twice in the subcontinent. In the inaugural edition, the tournament run rate was 7.99 per over, and 22.64 runs per wicket; in the current edition, leading up to the first semi-final, it was 7.52 runs per over and 22.13 runs per wicket. Excluding the preliminary stages of the tournament, the run rate was 7.65, and the average 22.22. The three editions in between have had run rates ranging between 7.53 and 7.63. Evidently, all the batting and bowling strategies seem to have cancelled each other, and we've been left with overall numbers which haven't changed much at all.
In the very first match of the inaugural World Twenty20, between South Africa and West Indies in Johannesburg, both teams topped 200, with South Africa chasing down West Indies' 205 with more than two overs to spare. Later in the tournament, there was another match in which both teams scored 200 or more: in the game between India and England in Durban - made famous by Yuvraj Singh's six sixes in an over - England responded to India's 218 by scoring 200. In that tournament, there were five totals in excess of 200, but in four World T20 tournaments since then, there have been only two such scores. The highest in this tournament so far has been South Africa's 196 against England.
The balls per four and six are also very similar in the last two tournaments - around nine balls per four, and 26 per six. Batsmen didn't clear the fence as often in 2009, when England hosted the competition, but in the West Indies in 2010 there was a six every 21 balls.
| Edition | Average | Run rate | Balls per 4 | Balls per 6 | 200+ scores |
| 2014 | 22.13 | 7.52 | 9.02 | 26.00 | 0 |
| 2012 | 23.64 | 7.63 | 9.11 | 26.35 | 1 |
| 2010 | 21.42 | 7.53 | 11.78 | 21.36 | 0 |
| 2009 | 22.62 | 7.62 | 9.04 | 36.31 | 1 |
| 2007 | 22.64 | 7.99 | 9.05 | 22.50 | 5 |
The one significant trend seen in T20 cricket in the last few years has been the increased use of spin bowling, and that's reflected in the stats in the last three World Twenty20s as well: spinners have bowled more than 40% of the overs in each of the last three editions, peaking at almost 46% in 2012.
In the last two tournaments, spinners have gone at less than seven runs per over, while the faster bowlers have conceded more than 7.50. This year, there's been a difference of 0.80 between the economy rates of spin and pace, while spinners also have a better bowling average.
| Spin | Pace | ||||||
| Overs | Ave | Econ rate | Overs | Ave | Econ rate | Spin % overs | |
| 2014 | 491.1 | 21.54 | 6.88 | 672.5 | 25.35 | 7.68 | 41.84 |
| 2012 | 446.0 | 24.34 | 6.87 | 526.2 | 25.07 | 7.90 | 45.73 |
| 2010 | 418.5 | 25.96 | 7.19 | 564.4 | 21.04 | 7.52 | 42.58 |
| 2009 | 383.4 | 20.32 | 6.62 | 593.0 | 25.67 | 7.96 | 38.38 |
| 2007 | 237.2 | 23.55 | 7.84 | 737.0 | 25.26 | 7.78 | 24.07 |
The over-wise run chart for this tournament, and for the earlier ones, also offer a glimpse into how scoring patterns have changed in 20-over international cricket. In the earlier days, there seemed to be more urgency at the start of the innings - and the need to fully capitalise on the Powerplay overs - but perhaps not as much outrageous hitting in the last five overs. In the 2007 World Twenty20, the average runs scored in the first ten overs by the team batting first was 72, and in the last ten 90, with the last five fetching about 48. In the 2009 edition, the average in the first ten was 74, and in the last ten 84, with the last five fetching 49. (These are all stats for teams batting first, because the numbers for teams chasing are often influenced by the kind of target they're up against.)
This year, teams batting first have generally been pretty subdued in the first ten, scoring, on average, about 68 runs. In the main stage of the tournament, the last ten overs have been extremely productive, with teams batting first averaging 90 runs in these overs. That's 22 more than the average in the first ten; in 2009, the difference in average runs scored in the two sets of ten overs was only ten. The last five has also been more productive, with an average of 51 being scored during this period. Each of the last four overs averaged more then ten in the main stage of the tournament, while none of the previous 16 touched even nine per over.
Clearly, teams were generally more careful about keeping wickets in hand: in each of the 16th and 17th overs, only five wickets fell during the first innings in the main stage of the competition. In the 18th there were nine wickets, while 11 fell in the 19th and 22 in the last over.
That pattern of wickets falling was quite different even in the 2012 edition, when 13 wickets fell in the 11th over for the teams batting first (seven in the main stage this time), and 17 in the 16th over (five this time). It seems this is the approach that seems to agree with most teams at the moment - keep wickets in hand, start slow, and then have a blast at the end. It worked well for West Indies, till the rains denied them the opportunity to bat those last five overs in the semi-final.
| 2014 | ||||||
| Over No. | Overall | Main stage | 2012 | 2010 | 2009 | 2007 |
| 1 | 5.50 | 6.00 | 4.92 | 5.59 | 6.85 | 5.57 |
| 2 | 6.15 | 6.05 | 5.44 | 7.51 | 7.00 | 6.42 |
| 3 | 8.00 | 8.65 | 6.68 | 7.29 | 7.66 | 6.65 |
| 4 | 6.90 | 6.00 | 6.80 | 8.81 | 8.51 | 7.50 |
| 5 | 6.84 | 6.35 | 8.76 | 6.77 | 10.29 | 7.11 |
| 6 | 7.65 | 6.65 | 7.44 | 6.51 | 6.74 | 7.30 |
| 7 | 6.34 | 7.00 | 6.60 | 6.25 | 6.18 | 7.46 |
| 8 | 7.46 | 8.10 | 6.68 | 5.88 | 6.84 | 6.96 |
| 9 | 6.43 | 6.00 | 7.96 | 7.74 | 7.65 | 7.84 |
| 10 | 6.28 | 7.55 | 7.72 | 6.44 | 6.61 | 8.76 |
| 11 | 7.23 | 7.84 | 5.96 | 7.29 | 7.69 | 8.50 |
| 12 | 7.58 | 8.47 | 7.28 | 6.55 | 6.50 | 8.80 |
| 13 | 7.45 | 7.57 | 8.84 | 9.07 | 6.65 | 8.42 |
| 14 | 7.25 | 8.10 | 7.76 | 8.18 | 7.80 | 8.11 |
| 15 | 7.41 | 7.63 | 9.72 | 6.81 | 6.96 | 8.76 |
| 16 | 8.67 | 8.47 | 7.12 | 10.31 | 10.30 | 9.69 |
| 17 | 9.67 | 11.00 | 8.64 | 9.34 | 10.11 | 8.86 |
| 18 | 9.60 | 10.57 | 10.04 | 11.57 | 7.92 | 8.24 |
| 19 | 9.75 | 10.26 | 11.40 | 9.42 | 9.02 | 11.36 |
| 20 | 9.79 | 10.58 | 11.95 | 8.28 | 11.41 | 9.54 |
S Rajesh is stats editor of ESPNcricinfo. Follow him on Twitter