Bowlers made hay, Root rose, Kohli fell, and debutants had a ball
All the stats highlights from 2021, when ball dominated bat in Tests, Pakistan called the shots in T20Is, and ODIs faded into insignificance
S Rajesh
04-Jan-2022
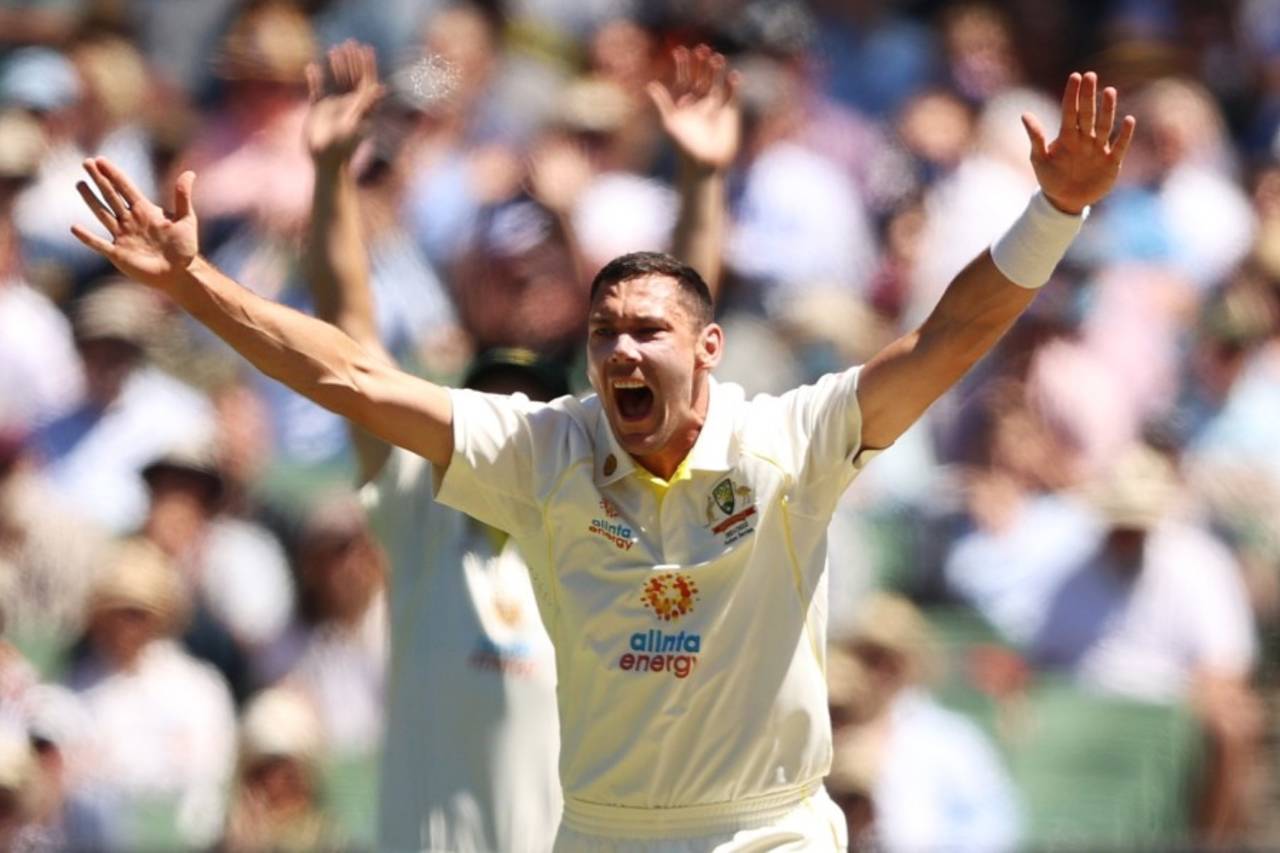
Bowlers who debuted in Tests in 2021 contributed 231 wickets at 26.44 • Getty Images
A tough year for batters
In the last 40 years, only once has the average runs-per-wicket figrure in Tests been lower than it was in 2021, when 28.78 were scored per dismissal. This one stat confirms that 2021 was another year when bowlers held sway, and batting was generally a difficult task.
The only year in this period when bowlers dominated even more was 2018, when each wicket cost 27.58 runs. In fact, these are two of four years in the last 40 when the average has slipped below 30; the other two were 2000 and 1988.
If you look at more metrics, they all tell a tale of bowlers dominating and batters struggling: 17 team totals of 400-plus were scored in 44 Tests, a rate of one every 2.59 matches. Only thrice in the last 40 years have they been more scarce - in 2018 (2.67), 1992 (2.60) and 1988 (3.00). The story is similar in terms of innings per century: 28.53 in 2021; there have been just two instances of longer waits between hundreds, in 2020 (29.54) and 1988 (34.44).
Two-hundred-and-fifty-three 50-plus scores were made in Tests in 2021, of which only 58 were converted into hundreds. That is a conversion rate of 22.92%, which indicates that batting wasn't easy even after the batters got in. The rate was 20.63 last year, but that was a truncated year, which featured about half the number of matches as in a regular year. Before that, you would have to go back to 1995 to find a year with a poorer conversion rate of fifties to hundreds.
Unlike in several other years, 2021 was one in which both fast bowlers and spinners flourished. The pacers conceded 27.14 runs per wicket - an average next only to those of 2018 and 2019 among the last 40 years - while spinners averaged 30.52, second only to 2018 in this period.
Of the 24 bowlers who took 20 or more Test wickets in 2021, 20 averaged lower than 30, and eight under 20 runs per wicket. The 11 bowlers who picked up 30 or more wickets in the year included six fast bowlers and five spinners. At the top of the pile was R Ashwin, who had a phenomenal year, picking up 54 wickets at 16.64. Never has a spinner taken 50-plus wickets in a calendar year at a better average: the best before 2021 was Muthiah Muralidaran, who took 90 at 16.90. In fact, Ashwin is in the top five for all bowlers with a 50-wicket cut-off, and features twice in the top eight.
2018-2021: four fun years for bowlers
Bowlers dominating has been a trend for the last few years, during which run-scoring has become relatively difficult again, after the high-scoring first decade of this century. As mentioned earlier, the average runs per wicket in 2018 was 27.58, the lowest in the last 40 years. In the next two years after that, the average was 30.83, which means in the last four years (2018-2021), a wicket has fallen every 29.15 runs, which is far cry from the batting-dominant 2000s: in the four-year period from 2007 to 2010, the average was 35.89. Thus, batting averages have fallen around 18% in these last four years, compared to the 2007-10 period.
In fact, the last time the runs-per-wicket value was lower than 29.15 over four consecutive calendar years was way back in 1960: between January 1957 and December 1960, the average was 29.04. Nineteen bowlers have taken over 75 wickets since the start of 2018, of whom 13 average lower than 25. Clearly, bowlers haven't had it so good in a long, long time.
Root vs Kohli, and other batting stories
Despite run-scoring being difficult through the year, and despite him leading a team that offered no batting support, Joe Root racked up 1708 Test runs in 2021, easily the highest in a year in which no other batter touched 1000. That was the one positive batting stat in the year; most of the other Test batting records in the year were forgettable ones. (For more on Root's incredible year, click here.)
On the other hand, 2021 was the year when Virat Kohli's batting slump became official; he had averaged 19.33 in Tests in 2020, but that was only over six innings. In 2021, he averaged 28.21 in 19 innings, with just four fifties. That makes it two successive years when Kohli hasn't scored a Test hundred. The last time he didn't get one in a calendar year before 2020 was in 2011.
Obviously, the career averages of Root and Kohli took highly contrasting paths, thanks to the year they had. Root started 2021 with an average of 47.99, while Kohli was at 53.41 - a difference of 5.42. By the time the year ended, the gap had shrunk to 0.44; Kohli's average dropped to 50.34 and Root's lifted to 49.90.
In fact, Kohli is on an unwanted streak of 14 consecutive Tests in which his career average has dropped at the end of the game. It is the longest such streak by an India batter, and the joint second-longest for any batter, next only to Grant Flower's 16-match streak between 1998 and 2000. If Root and Kohli continue in their respective veins of form in 2022, the two lines in the graph above will soon cross each other.
Meanwhile, two other Indians struggled for runs in the middle order: Cheteshwar Pujara averaged 28.08 in 26 innings, while Ajinkya Rahane fared worse, averaging 20.82 from 23 innings. These numbers meant that collectively, India's numbers three, four, and five averaged 29.02 in 2021, their third-lowest in the last 30 years.
Pujara's aggregate of 702 runs was enough to put him in fifth place in terms of Test runs scored in 2021, despite averaging under 30. That makes him the first batter since Neil Harvey in 1956 to finish in the top five in terms of aggregate despite averaging under 30.
Rahane's average of 20.82, meanwhile, is the third-lowest in any year for a batter in the top six who played at least 20 innings in the year. Both cases are illustrative of a team management being extremely patient with out-of-form players. In 2022, Pujara and Rahane need to score plenty of runs to justify that patience. The top three in the list below has two entries from 2021 - Dom Sibley is a spot above Rahane, averaging 19.77 from 20 innings. The top six has two more Indians in the list too - Sourav Ganguly in 2001, and KL Rahul in 2018.
Debutant bowlers on a roll
Scott Boland destroyed England in the third Ashes Test with stunning figures of 6 for 7, Axar Patel took five five-fors in five Tests, and Ollie Robinson was arguably England's best bowler of the year, taking 37 wickets at 21.16. The common thread among all these bowlers? They all made their Test debuts in 2021.
Apart from being a great year for bowlers in general, 2021 was particularly good for debutant bowlers. Players who made their Test debuts in 2021 went on to take 231 wickets in the format over the year, at an average of 26.44, which is marginally better than the overall average for all bowlers in the year (28.58). Sixteen five-fors were taken by bowlers who made their debuts in 2021, which is the second-highest in Test history: the only year with more five-fors by debutants was 2011, when there were 18. The overall wickets tally by debutants, of 231, is the fifth-highest in any year - 2011 leads the way again, with 321.
Last year's collective bowling average for debutants, of 26.44, is the best in the last 33 years, and also the best in the 18 years in which bowlers making their debuts took at least 150 wickets. (Shardul Thakur, who took 16 wickets at 23.18 in 2021, narrowly missed out on being included in the list below. He played his only other Test in 2018, but bowled only ten deliveries in that game.)
Pakistan dominate T20Is
Their defeat in the T20 World Cup semi-final notwithstanding, Pakistan were the team to beat in this format in 2021: they won 20 games and lost only six. Against the top 12 teams, they had an 18-6 win-loss record, easily the best among all teams in the year, and the third-best for a team in any year, with a 12-match cut-off (against the top 12 teams).
The backbone of their success was the opening pair of Babar Azam and Mohammad Rizwan. Rizwan scored 1326 runs and Babar 939, the two top aggregates for a batter in any calendar year; together they contributed 56.3% of Pakistan's total bat runs. As a pair, Babar and Rizwan collected 1380 runs in 2021, again the most by any pair in a calendar year. (The next-best is only 756.) (Here are some more numbers on this fantastic batting duo .)
With Haris Rauf, Hasan Ali and Shaheen Shah Afridi all taking 20-plus wickets apiece, and Shadab Khan conceding less than seven an over, Pakistan had all the bowling bases covered as well. A World Cup title eluded them but they have the chance to make amends in 2022.
The other aspect that stood out was the sheer number of T20I matches played in 2021. Obviously, the overall number grew because of the addition of several teams to the T20I fold since 2019, but even excluding the lesser teams, the increase was significant: there were 110 T20Is among the top 12 teams in 2021, a 57% increase over the previous highest of 70, in 2018.
The forgotten format of 2021
With the T20 World Cup and the World Test Championship played in 2021, it was quite clear that ODIs would get short shrift through the year. Only 71 matches were played in the format, the second-lowest in the last 30 years (excluding pandemic-hit 2020). Australia played only three ODIs, their lowest in a year since 1978, while India played six, their lowest since 1980.
With the two other formats getting top priority, and with Covid-related restrictions affecting travel and itineraries, the top players were often unavailable for ODIs. India's Test squad was in England when a second squad played ODIs and T20Is in Sri Lanka. England picked five debutants for the first game of their home series against Pakistan.
All of this meant the average experience of a player playing an ODI in 2021 was the lowest in the last 35 years. Last year, a player came into an ODI with an average of 38.1 matches, the least since 1986, when it was 36.9. Since 1987, it was more than 40 matches every year till 2020, with the figure going up to 91.6 in 2005, 86.7 in 2002, and 78.3 in 2012. The graph above shows the average experience for each year since 2011, and puts into context the huge dip last year.
With inputs from Shiva Jayaraman
S Rajesh is stats editor of ESPNcricinfo. @rajeshstats