Using runs per Test to measure consistency
While we largely look at averages to judge how well a batsman has done over a period of time, a study of match runs often gives a clearer picture
Anantha Narayanan
28-May-2016
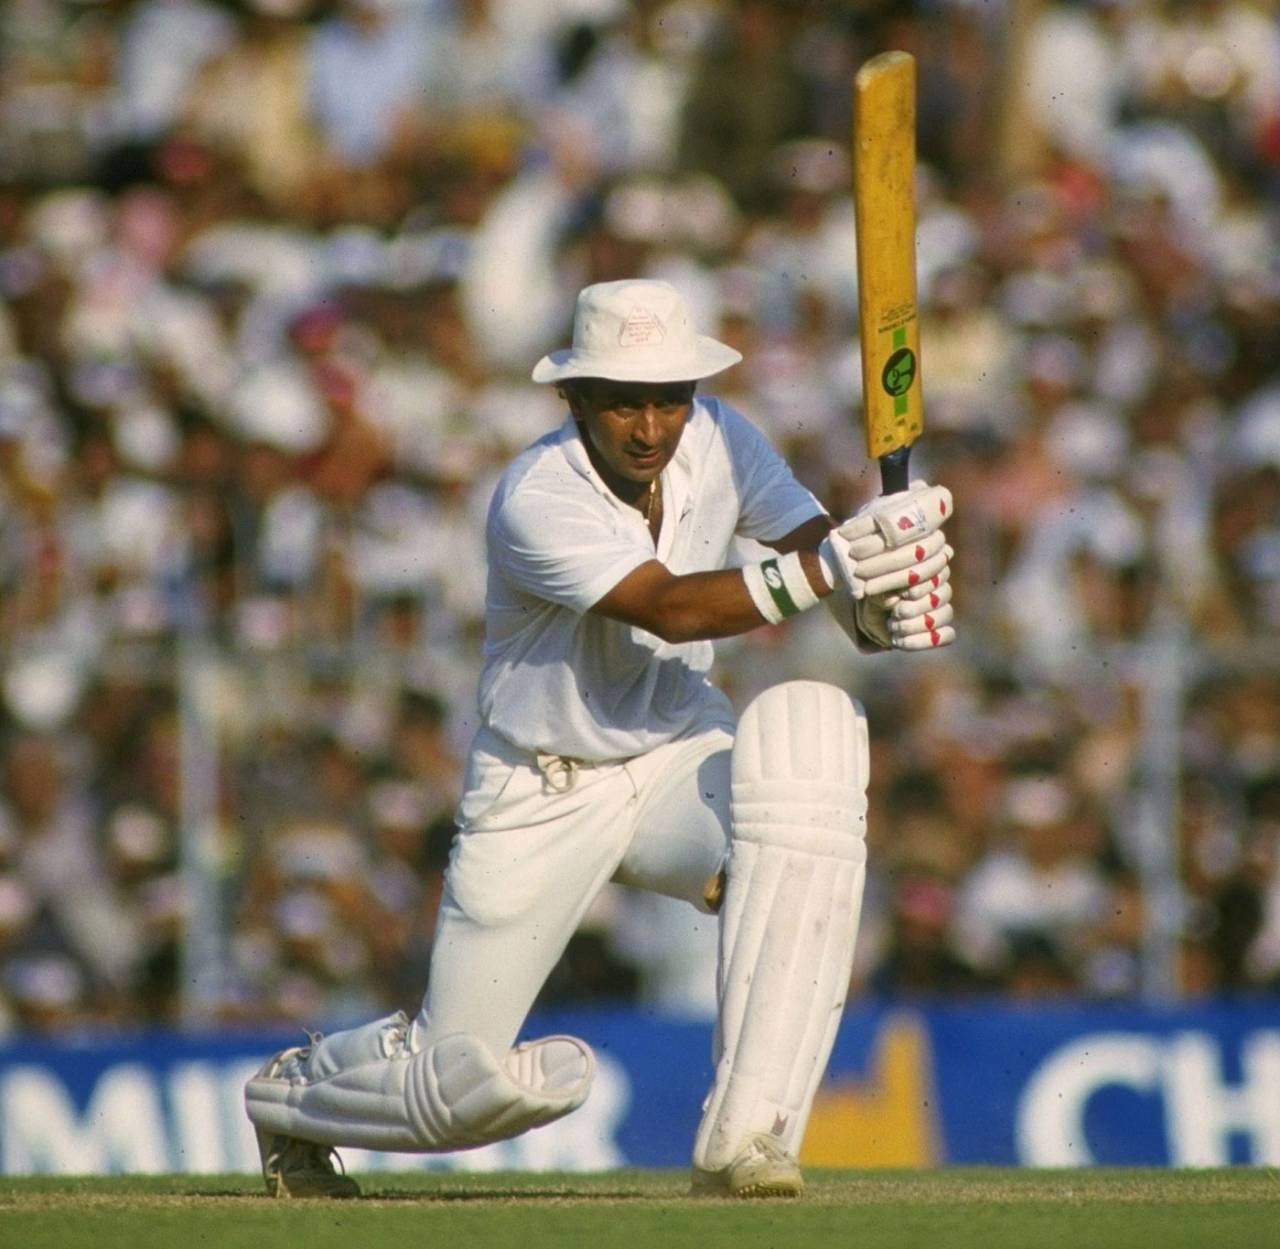
Apart from Don Bradman, Sunil Gavaskar was the only batsman to reach a near-100 Runs per Test in 50 matches • Getty Images
There are quite a few measures used while analysing Test batsmen's performances. Let us first get out of the way the measures such as runs and centuries scored, which are basically accumulated over a long number of years and Tests. There is a lot to admire in a batsman who has played over 150 Tests, but then we must accept that he is likely to accumulate over 12,000 runs. Scoring rate is a non-starter since it is not available for over two-thirds of the matches.
The Batting Average is the most popular one but has a few shortcomings. The variations in averages because of not-outs is the major one. A small analysis highlights this problem. In batting positions 1-2, there are 560 not-outs (4.5%) out of 12,558 innings. In batting positions 3-5, there are 1319 not-outs (7.3%) out of 18,107 innings. In batting positions 6-8, there are 1822 not-outs (11.0%) out of 16,603 innings. That is one heck of a variation. Intrinsically this measure is unfair to the openers.
Runs per Innings (RpI) is quite good. However, the problem of low not-out scores remains. I have analysed this extensively and come out with solutions fine-tuning the innings count with adjustments based on the size of innings. These work very well. However, it has to be accepted that these are only tweaks to iron out a basic problem. This measure is unfair to middle-order batsmen.
That leaves us with the Runs per Test (RpT) measure. When we sit down and looks at all these measures we can easily see that the RpT measure is an excellent one. The benefits are outlined below.
1. The Test is the most important playing unit in Test cricket. An innings is only a means to an end - to win the Test, and if not possible, to draw the Test. As such it is correct to measure the performance by players in one Test. Without any doubt, the batting and bowling performances in the Test go towards getting a favourable result.
2. The batsman is allowed to make up for failure in the first innings with a compensating performance in the second.
3. Alternatively, if a batsman scores reasonably well in the first innings, he would not mind failing in the second innings, maybe with a specific objective of speeding up the scoring.
4. The effect of the not-out and batting late in the innings are neutralised, to a certain extent.
Some readers may ask: Why not go for a series as the unit? The fundamental problem is that a series is of completely uncertain length. It could vary from one to six Tests. It is played on different grounds and along with and against differing sets of players.
Let me clarify that I am not advocating the replacement of the Batting Average with RpT. The average is an excellent measure, ingrained in our collective Test-cricket-following mindsets. Many of us have spent decades working with the average. I am only suggesting that the RpT measure is an underrated and under-used one and should be given more exposure.
The article is current up to and including the Headingley Test, which finished in under two day's play. The early finish allowed me to include that Test. It was somewhat significant since the values of Alastair Cook, Joe Root and Angelo Mathews were changed.
These stalwarts reached 95 RpT
The article consists of two parts. The first part is an extension of the previous article. Using the RpT, rather than the average, as the criterion, I look at the batsmen who reached the pinnacle in their careers. The second part is an important one in that I look at the consistency of batsmen by looking at the RpT as the measure rather than the runs scored in an innings.
The article consists of two parts. The first part is an extension of the previous article. Using the RpT, rather than the average, as the criterion, I look at the batsmen who reached the pinnacle in their careers. The second part is an important one in that I look at the consistency of batsmen by looking at the RpT as the measure rather than the runs scored in an innings.
In this article I will only look at the career span starting with the first Test. Responding to many readers' comments, my next article will look at a floating period within a batsman's career to determine their best periods, both from the average and RpT points of view. Afterwards, the bowler's pinnacle will be covered.
As usual, I started with a high bar. I set the cut-off at 30 Tests and 100 as the RpT cut-off. A cut-off based on the number of Tests seemed more logical than one with runs. Anyhow these two are closely related measures. To my surprise, I learnt that only two batsmen, Don Bradman and Everton Weekes, reached 100.0 in their careers. So this is some special measure indeed. The 100.0 is somewhat equivalent to an average of 70.0. Then I lowered the cut-off to 90.0 and 24 batsmen trooped in. That is a convention of batsmen and I did not want to present batsmen like Gautam Gambhir, Michael Hussey et al who had chanced into this mark. Hence I set the cut-off at a stiff 95.0 and had a nice collection of 12 batsmen who had reached this mark. So the cut-off stayed at the rather odd, but somewhat high, figure of 95.0.
Given below is the table of the dozen batsmen who reached 95.0 in their career, after the 30th Test. They are ordered by the number of such occurrences.
| Tests | Runs | RpT | Test# | Year | Tests | Runs | RpT | RpT > 95.0 | |
| DG Bradman | 52 | 6996 | 134.5 | 263 | 1938 | 34 | 4854 | 142.76 | 23 |
| SM Gavaskar | 125 | 10122 | 81.0 | 854 | 1979 | 50 | 4947 | 98.94 | 19 |
| ED Weekes | 48 | 4455 | 92.8 | 404 | 1955 | 31 | 3164 | 102.06 | 15 |
| BC Lara | 131 | 11953 | 91.2 | 1303 | 1995 | 31 | 3048 | 98.32 | 5 |
| RN Harvey | 79 | 6149 | 77.8 | 392 | 1954 | 31 | 3028 | 97.68 | 5 |
| ..... | |||||||||
| H Sutcliffe | 54 | 4555 | 84.4 | 220 | 1932 | 40 | 3839 | 95.97 | 3 |
| WR Hammond | 85 | 7249 | 85.3 | 226 | 1933 | 38 | 3731 | 98.18 | 2 |
| KP Pietersen | 104 | 8181 | 78.7 | 1842 | 2007 | 30 | 2898 | 96.60 | 2 |
| L Hutton | 79 | 6971 | 88.2 | 386 | 1954 | 70 | 6665 | 95.21 | 1 |
| SPD Smith | 41 | 3852 | 94.0 | 2171 | 2015 | 30 | 2926 | 97.53 | 1 |
| IVA Richards | 121 | 8540 | 70.6 | 881 | 1980 | 33 | 3143 | 95.24 | 1 |
| AD Nourse | 34 | 2960 | 87.1 | 334 | 1951 | 30 | 2867 | 95.57 | 1 |
I will only discuss in depth the five batsmen who reached an RpT value of 95.0 in five or more Tests.
Don Bradman leads the table as expected. He averaged 132.3 runs per Test in his 30th Test and maintained this until the end of his career, 22 Tests away. Hence there are 23 such occurrences. He reached a peak value of over 142 in his 34th Test. Anything more would be gilding the lily.
Then comes the little master, Sunil Gavaskar. He was virtually nowhere in the Average stakes, mainly because he opened the batting, but is very strongly placed here. He reached the 95.0 mark in his 41st Test and re-visited that mark 18 more times. It is indeed remarkable that he achieved this feat while facing top-quality fearsome bowling and without the aid of any protective equipment.
There were no cheap runs to be had. He faced Sri Lanka in seven Tests, but this was a tough and battle-hardened Sri Lanka. His away average was better than his home average. He dropped off towards the end of his career and finished with an RpT value of 81.2, which is bettered only by Virender Sehwag and equalled by Rahul Dravid amongst Indian batsmen. I have no hesitation in saying that Gavaskar was the best Test (I repeat, Test) batsman India have ever had. His RpT value of 98.9 at the end of 50 Tests is, almost inarguably, the best 50-Test run of any batsman, barring Bradman.
Apart from Bradman, Everton Weekes is the only batsman who reached an RpT value of 100.0 in his career. Weekes went past 100.0 in six Tests between the 31st and 38th. His batting lost some of its shine in the second half of his career and he finished with an RpT value of 92.8. It is a pertinent fact that he faced the relatively weaker Indian and New Zealand bowling attacks in 16 of the 48 Tests he played. However, the overall numbers are very impressive.
Brian Lara averaged more than 95.0 RpT in the 30th Test and maintained this in the next five Tests. His peak was after the Oval Test during the 1995 tour to England when he reached 98.32, which is only just below Gavaskar's high numbers. He needed a mere 52 in the second innings, which was not played. His career RpT value is an impressive 91.2.
Neil Harvey averaged more than 95.0 RpT in five Tests between his 30th and 40th Tests. His highest was 97.7. Unfortunately the second half of his career was so poor that he finished with a low 77.2. Just for comparison, he averaged 95.8 in his first 40 Tests and 59.4 in his next 39 Tests. This is probably the greatest fall, though Jimmy Adams may challenge it.
Kevin Pietersen, twice, and Steven Smith, once, reached this level in their careers. Smith, with a current RpT value of 94.0, which is second only to Bradman, can reach this high level again with aggregates like 150 in the coming Tests.
A re-look at Batsmen consistency
Ric Finlay and others have done excellent work on the intriguing topic of measuring batsmen's consistency. Ric did some pioneering work well over 30 years back. I myself have dabbled with it a few years back. To my knowledge most of us used Runs-scored-in-innings as the variable to measure the consistency of batsmen. In this article I will deviate slightly. I will use the Runs-scored-in-match as the variable to measure the consistency. I have already listed the benefits of using the RpT value. In this analysis the Match Runs variable provides us with the same benefits. In addition it is clear that the Mean of Match Runs (RpT) is at a level about 60-70% higher than the Mean of Innings Runs (Average) while the range of values changes only by about 15% (0 to 400 as against 0 to 456). This provides for a tighter collection of data. Since I am neither a statistician by background nor by profession, I tend to give common-sense-based explanations.
Ric Finlay and others have done excellent work on the intriguing topic of measuring batsmen's consistency. Ric did some pioneering work well over 30 years back. I myself have dabbled with it a few years back. To my knowledge most of us used Runs-scored-in-innings as the variable to measure the consistency of batsmen. In this article I will deviate slightly. I will use the Runs-scored-in-match as the variable to measure the consistency. I have already listed the benefits of using the RpT value. In this analysis the Match Runs variable provides us with the same benefits. In addition it is clear that the Mean of Match Runs (RpT) is at a level about 60-70% higher than the Mean of Innings Runs (Average) while the range of values changes only by about 15% (0 to 400 as against 0 to 456). This provides for a tighter collection of data. Since I am neither a statistician by background nor by profession, I tend to give common-sense-based explanations.
How do we measure the consistency of a batsman? We will use the tried, tested and proven method. Each batsman is treated as an independent entity. His Match Runs values are tabulated (so to speak) and the Mean (in reality RpT) arrived at. Then we determine the Standard Deviation, which is a variable even non-statisticians are familiar with. The SD indicates the dispersion of the values from the Mean. The higher the SD, the more the dispersion.
However the SD by itself is not enough. This is because the Mean values (RpT) range from 134.5 for Bradman to 35.0 for Shaun Pollock. So we cannot conclude that Bradman, with a SD of 93.9, has a wider dispersion and Pollock, with a SD of 30.2, has a low dispersion. Alternatively, let us look at three totally dissimilar batsmen: Mark Taylor, Doug Walters and Shivnarine Chanderpaul. All have identical RpT values of 72.4, but widely varying SD values of 63.6, 58.9 and 51.3 respectively. It is clear, based on a perusal of these numbers, that Taylor was quite inconsistent, Walters less so and Chanderpaul, very consistent.
Hence we have to convert the SD and Mean, both runs, into a dimension-less value. This is determined by dividing the SD by Mean. This is called the Coefficient of Variation, or for our purposes we can call it Consistency Index (CI). This is expressed as a %.
Now we can safely say that the higher the CI (the CoV) is, the more dispersed the values are from the Mean, and the batsmen is less consistent. The lower the CI is, the less dispersed the values are from the Mean, and the batsmen is more consistent. My apologies to academicians if my explanations lack the scientific terms, touch and nuances. But I go by my cricketing knowledge and common sense. The CI values are somewhat high (a range of 60% to 105%) because of the lopsided distribution of scores. For a typical batsman, the range of scores could be 0 to 200 and the mean could be 50: not exactly around the middle but around 20-25% of the maximum.
| Team | Tests | Runs | RpT | Tests<25% | % | S D | Consistency Index | |
| RC Fredericks | Win | 59 | 4334 | 73.5 | 6 | 10.2% | 44.9 | 61.2% |
| JB Hobbs | Eng | 61 | 5410 | 88.7 | 7 | 11.5% | 55.6 | 62.7% |
| IR Redpath | Aus | 66 | 4737 | 71.8 | 8 | 12.1% | 45.9 | 63.9% |
| CC McDonald | Aus | 47 | 3107 | 66.1 | 5 | 10.6% | 43.5 | 65.7% |
| GP Thorpe | Eng | 100 | 6744 | 67.4 | 16 | 16.0% | 44.4 | 65.9% |
| AD Mathews | Slk | 57 | 4054 | 71.1 | 5 | 8.8% | 47.3 | 66.4% |
| RB Kanhai | Win | 79 | 6227 | 78.8 | 8 | 10.1% | 53.4 | 67.7% |
| Misbah-ul-Haq | Pak | 61 | 4352 | 71.3 | 8 | 13.1% | 48.5 | 68.0% |
| RA Smith | Eng | 62 | 4236 | 68.3 | 9 | 14.5% | 47.1 | 68.9% |
| DG Bradman | Aus | 52 | 6996 | 134.5 | 9 | 17.3% | 93.9 | 69.8% |
| KF Barrington | Eng | 82 | 6806 | 83.0 | 16 | 19.5% | 58.0 | 69.8% |
| AL Hassett | Aus | 43 | 3073 | 71.5 | 5 | 11.6% | 49.9 | 69.9% |
As we have already seen the Consistency Index is the percentage ratio between the SD and Mean. The most consistent of the batsmen are those with CI values below 70%. The most consistent batsman is Roy Fredericks. For someone known for his attacking batting this is indeed remarkable. His CI is 61.2%. I decided to do a recon of the match runs of Fredericks. I was curious to know whether a visual perusal will bring out the consistency. I will do this only for the first two batsmen. I have presented below the match scores of Fredericks.
79, 123, 69, 40, 39, 29, 17, 4, 64, 123, 17, 61, 80, 52, 49, 196, 100, 33, 83, 75, 52, 120, 92, 36, 81, 38, 162, 51, 70, 94, 32, 98, 103, 23, 5, 121, 33, 141, 58, 77, 53, 169, 85, 72, 10, 28, 54, 8, 52, 88, 57, 138, 50, 115, 157, 76, 177, 57, 58, 89.
Just peruse and marvel at the scores. In just three of the 59 Tests Fredericks played, he had single-digit run aggregates. In only six Tests did he score fewer than 25% of his RpT value. So it is clear that these are not just numbers. We are able to do some level of visual validation.
Now for Jack Hobbs. Let us see his career summary in terms of the Match Runs.
83, 111, 49, 57, 85, 62, 28, 42, 124, 123, 104, 1, 187, 85, 132, 190, 178, 77, 4, 107, 82, 19, 77, 98, 82, 23, 133, 161, 44, 108, 142, 141, 40, 74, 0, 76, 211, 38, 30, 172, 176, 146, 66, 13, 19, 119, 137, 74, 137, 53, 159, 60, 40, 69, 75, 207, 62, 152, 20, 42, 31, 56.
In just three of the 61 Tests Hobbs played, he has had single-digit run aggregates. In only seven Tests did he score fewer than 25% of his RpT value. So it is clear that these are not just numbers. There is a clear indication that a low CI value indicates a good degree of consistency.
Then come two Australian batsman, Ian Redpath and Colin McDonald, who played in the 1950s, '60s and '70s. Rohan Kanhai, surprisingly, and Misbah-ul-Haq, not so surprisingly, are in the top 12. All of us had the feeling that Angelo Mathews is a very consistent batsman and his high placing confirms this feeling. It will be of interest for the readers that Root was in the top 12 when I started the article. I had almost completed writing when the first Test ended and Root, because of his duck at Headingley, went off and Lindsay Hassett took his place. Bradman, Ken Barrington and Hassett complete the top 12. Bradman has a high SD. However since these are variances from a very high mean, his overall level of consistency is confirmed. He aggregated single-digit runs in three Tests: All 0s.
| Team | Tests | Runs | RpT | Tests<25% | % | S D | Consistency Index | |
| Zaheer Abbas | Pak | 78 | 5062 | 64.9 | 19 | 24.4% | 67.6 | 104.1% |
| MS Atapattu | Slk | 90 | 5502 | 61.1 | 19 | 21.1% | 62.9 | 102.8% |
| IA Healy | Aus | 119 | 4356 | 36.6 | 27 | 22.7% | 36.3 | 99.1% |
| DL Vettori | Nzl | 113 | 4531 | 40.1 | 31 | 27.4% | 39.3 | 97.9% |
| Ijaz Ahmed | Pak | 60 | 3315 | 55.2 | 17 | 28.3% | 52.7 | 95.3% |
| Hanif Mohammad | Pak | 55 | 3915 | 71.2 | 10 | 18.2% | 67.7 | 95.1% |
| ST Jayasuriya | Slk | 110 | 6973 | 63.4 | 20 | 18.2% | 60.3 | 95.1% |
| RJ Shastri | Ind | 80 | 3830 | 47.9 | 16 | 20.0% | 45.5 | 95.0% |
| GW Flower | Zim | 67 | 3457 | 51.6 | 13 | 19.4% | 48.8 | 94.6% |
| DL Amiss | Eng | 50 | 3612 | 72.2 | 12 | 24.0% | 68.1 | 94.3% |
| KWR Fletcher | Eng | 59 | 3272 | 55.5 | 12 | 20.3% | 52.0 | 93.8% |
| JC Adams | Win | 54 | 3010 | 55.7 | 10 | 18.5% | 51.8 | 92.9% |
Zaheer Abbas: surely an enigma. He had 200-plus Tests and sub-10 Tests interspersed right through his career. It is not often that the SD is higher than the Mean: a very unusual occurrence. I will show details of only his career.
39, 274, 40, 72, 7, 76, 61, 10, 15, 10, 24, 26, 67, 2, 255, 51, 20, 30, 11, 19, 186, 148, 9, 80, 23, 28, 272, 269, 42, 42, 135, 70, 47, 71, 53, 13, 5, 15, 26, 19, 35, 14, 8, 80, 90, 134, 44, 75, 12, 91, 126, 52, 215, 186, 168, 25, 13, 43, 22, 49, 85, 30, 59, 46, 94, 94, 8, 100, 87, 168, 26, 74, 2, 17, 18, 6, 0, 4.
In 79 Tests, Zaheer compiled single-digit aggregates in no fewer than ten Tests. In 19 of these Tests, a whopping 24.4%, he scored fewer than 25% of his RpT value. These are clear examples of a very high level of inconsistency.
Let us see Marvan Atapattu's topsy-turvy career. First, in numbers.
0, 1, 0, 47, 25, 18, 17, 26, 48, 139, 0, 129, 229, 48, 131, 19, 16, 35, 53, 24, 6, 29, 58, 25, 57, 2, 216, 43, 6, 18, 104, 26, 113, 60, 207, 54, 120, 10, 20, 18, 3, 201, 18, 0, 33, 84, 108, 201, 61, 84, 23, 25, 9, 150, 1, 192, 69, 16, 20, 77, 39, 0, 2, 168, 43, 64, 19, 0, 63, 17, 132, 170, 249, 14, 142, 34, 76, 0, 69, 129, 16, 29, 36, 18, 11, 7, 155, 56, 67, 105.
After a nightmare start of one run in the first six completed innings, Atapattu recovered quite well. However, he had single-digit aggregates in no fewer than 16 of the 89 Tests he batted in. In terms of the sub-25%-RpT Tests he fares better than Zaheer. All in all, quite a sine-curvish career.
When we look at some of the other batsmen in this lot, such as Jimmy Adams, Ravi Shastri, Dennis Amiss and Sanath Jayasuriya, our own non-numbers based perception that these batsmen were inconsistent is substantiated. Adams had the biggest difference between the first and second half of anyone's career. Daniel Vettori started his career as a No.9-10 batsman and ended as a genuine No. 6, with six centuries and an average exceeding that of Kris Srikkanth. This change is reflected in this table.
| Team | Tests | Runs | RpT | Tests#25% | % | S D | Consistency Index | |
| KP Pietersen | Eng | 104 | 8181 | 78.7 | 15 | 14.4% | 55.4 | 70.4% |
| L Hutton | Eng | 79 | 6971 | 88.2 | 11 | 13.9% | 65.5 | 74.2% |
| R Dravid | Ind | 164 | 13288 | 81.0 | 16 | 9.8% | 62.0 | 76.5% |
| GS Sobers | Win | 93 | 8032 | 86.4 | 11 | 11.8% | 67.0 | 77.5% |
| SR Tendulkar | Ind | 200 | 15921 | 79.6 | 37 | 18.5% | 62.2 | 78.1% |
| H Sutcliffe | Eng | 54 | 4555 | 84.4 | 11 | 20.4% | 66.7 | 79.1% |
| SM Gavaskar | Ind | 125 | 10122 | 81.0 | 26 | 20.8% | 65.2 | 80.5% |
| AN Cook | Eng | 127 | 9980 | 78.6 | 23 | 18.1% | 64.1 | 81.5% |
| WR Hammond | Eng | 85 | 7249 | 85.3 | 10 | 11.8% | 70.8 | 83.0% |
| KC Sangakkara | Slk | 134 | 12400 | 92.5 | 19 | 14.2% | 76.8 | 83.0% |
| IVA Richards | Win | 121 | 8540 | 70.6 | 25 | 20.7% | 59.4 | 84.2% |
| RT Ponting | Aus | 168 | 13378 | 79.6 | 32 | 19.0% | 67.7 | 85.0% |
| BC Lara | Win | 131 | 11953 | 91.2 | 25 | 19.1% | 77.9 | 85.4% |
This table is extracted from the middle areas of the complete table and covers batsmen who many followers will be interested in. Amongst this lot, Len Hutton, Dravid, Garry Sobers and Sachin Tendulkar represent the more consistent lot. Viv Richards, Ricky Ponting, Kumar Sangakkara and Lara represent the less consistent batsmen. It is also clear that the high scores made by a batsman like Lara have increased the SD values. That makes sense.
In the follow-up article I will work with a dynamic and floating period of Tests in which batsmen have performed very well, both from Average and RpT points of view.
I have to set up complex algorithms to do this. First, to extract the data on streaks and then to evaluate alternatives such as 3500 @ 70 against 4500 @ 65 against 6000 @ 60. It would be silly on my part to say that a batsman's best period was when he scored 3867 runs at 65.7 between Tests 34 and 75 when he might very well have scored 5532 runs at 64.2 later in his career. These stretches could also be overlapping. My head reels. I can expect a 1980 Sabina Park type pitch, and some chin music, while working on this article.
Anantha Narayanan has written for ESPNcricinfo and CastrolCricket and worked with a number of companies on their cricket performance ratings-related systems