Overseas masters
In the last six years South Africa have a 16-5 win-loss record in away Tests; no other team comes close during this period
S Rajesh
Nov 1, 2013, 2:34 AM
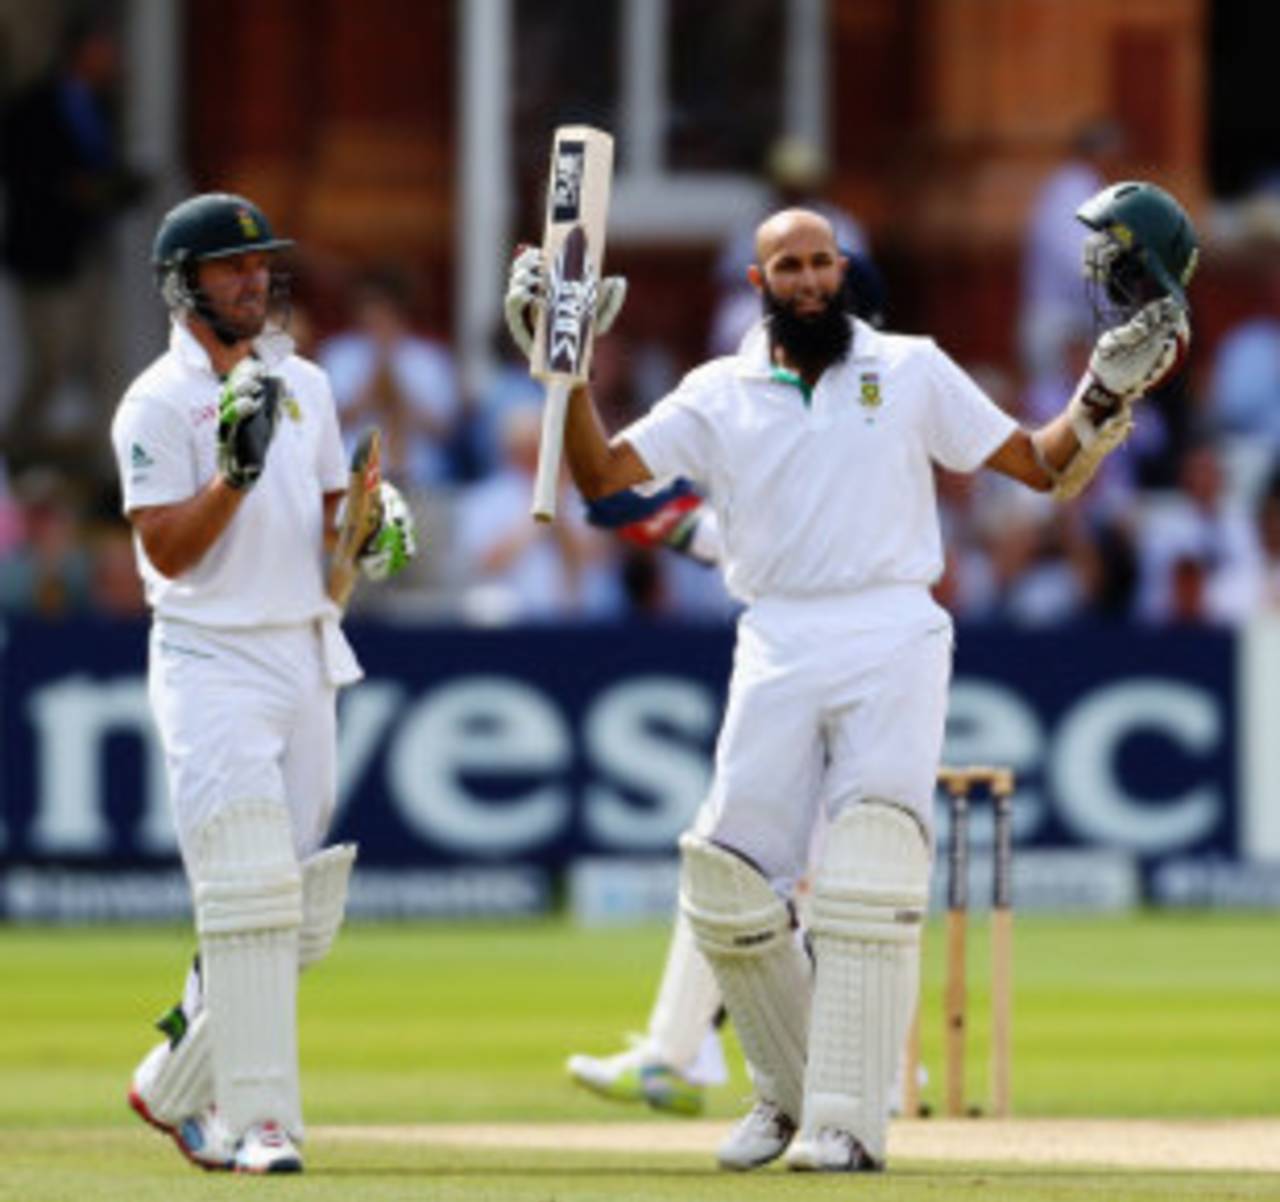
AB de Villiers and Hashim Amla have been prolific for South Africa, especially in Tests outside home territory in the last six years • Getty Images
When South Africa lost the first Test of their series against Pakistan in Abu Dhabi, they were in danger of losing their first overseas series since July-August 2006, when Sri Lanka beat them 2-0. (Even that series would have ended 1-1 if Sri Lanka hadn't squeezed out a one-wicket win in the second Test by chasing down a target of 352.) As it turned out, though, South Africa kept their magnificent overseas record intact by winning in Dubai and levelling the series 1-1, the 12th successive overseas series that they either won or drew.
Their record when playing away from home has been the stand-out aspect of South Africa's cricket over the last six years, and the one stat that's earned them the respect of all teams and critics. It's also differentiated them from the two previous No.1s, India and England, who rose to that position largely on the basis of home wins. During these six years, South Africa have actually achieved a much better winning ratio overseas (16 wins, 5 defeats, ratio 3.20) than at home (17 wins, 7 defeats, ratio 2.42).
In 12 overseas series during this period, South Africa have won eight and drawn four. The modern cricket schedule has also meant several short series, with little time to acclimatise, but they've coped fairly well with that too: out of five two-Test series, they have won two and drawn three. When given the opportunity to play longer series, South Africa have done even better, winning six out of seven which have consisted of three or more Tests. And the only series against one of the lesser sides was a 2-0 rout of Bangladesh in 2008.
A comparison with other teams during this period indicates how far ahead of the pack South Africa are. While they have a 16-5 win-loss record, the next best is England's 11-11. Pakistan and Australia have win-loss ratios of more than 0.7 as well. When tours to Bangladesh and Zimbabwe are excluded, South Africa are still clear leaders with a ratio of 2.80 (14 wins, 5 defeats), with England slipping to 0.81. Pakistan slip even further, as four of their 14 wins (and one defeat) came on tours to these countries.
South Africa's batting and bowling have both been pretty solid on these tours, but while a few other teams - Pakistan, Australia and England - have achieved similar bowling stats on tours, no other side has matched South Africa's batting prowess. They've averaged 43.43 on tours, around 18% better than the next-best batting team, England. Pakistan's bowlers have been the best of the lot, but the team has suffered because of their feeble batting, while Sri Lanka's bowlers have been the most toothless of the lot on tours.
| Team | Tests | W/ L | Ratio | Bat ave | Bowl ave |
| South Africa | 32 | 16/ 5 | 3.20 | 43.43 | 33.51 |
| England | 36 | 11/ 11 | 1.00 | 36.70 | 34.87 |
| Pakistan | 43 | 14/ 18 | 0.77 | 29.70 | 32.07 |
| Australia | 38 | 12/ 16 | 0.75 | 33.69 | 34.24 |
| India | 29 | 8/ 14 | 0.57 | 31.74 | 41.25 |
| West Indies | 23 | 4/ 10 | 0.40 | 32.66 | 41.40 |
| Sri Lanka | 23 | 4/ 12 | 0.33 | 34.35 | 49.40 |
| Bangladesh | 14 | 3/ 10 | 0.30 | 25.55 | 41.27 |
| New Zealand | 29 | 4/ 19 | 0.21 | 25.30 | 37.48 |
| Zimbabwe | 3 | 0/ 3 | 0.00 | 13.80 | 45.96 |
South Africa have been so good on tours that they invite comparisons with the two dominant teams of the last 35 years - West Indies of the early 1980s and Australia of the early 2000s. While the table below suggests their win-loss ratio isn't quite as good as those of West Indies and Australia, it's still highly impressive. Also, unlike South Africa, both those sides lost an away series during their dominant periods - West Indies lost to New Zealand in 1980, while India defeated Australia in 2001. (If the New Zealand series is excluded and the next two are included, West Indies' win-loss drops to 16-4 from 34 Tests; if one of those two series is included, it becomes 15-3 from 31 Tests.) Again, it's South Africa's batting average that stands out in comparison to the other two teams (though it's also a reflection of the times that their bowling average is the poorest among the three teams).
In terms of comparison with other teams during their peaks, West Indies were far and away the mightiest during that period: they had a win-loss of 5.33, while the next-best were New Zealand with 0.42 (3 wins, 7 defeats) in away Tests. During Australia's best period, England had a win-loss ratio of 1.18 while South Africa were close behind at 1.09.
| Team | Period | Tests | W/ L | Ratio | Bat ave | Bowl ave |
| West Indies | Dec 1979-Jan 1985 | 34 | 16/ 3 | 5.33 | 33.21 | 25.84 |
| Australia | Oct 1999-Mar 2005 | 32 | 24/ 6 | 4.00 | 40.13 | 26.74 |
| South Africa | Oct 2007-Oct 2013 | 32 | 16/ 5 | 3.20 | 43.43 | 33.51 |
With the batting average being so high for South Africa, it's no surprise that four from the team find themselves in the top ten of batting averages in overseas Tests (including neutral venues) in the last six years. AB de Villiers and Hashim Amla lead the way, with barely a run separating the two. de Villiers has been the more consistent, averaging more than 43 in all the countries he has played in except Bangladesh, where he averages 33 in two Tests. In the West Indies and the UAE his average is more than 100, while it's between 53 and 58 in Australia, England and India. He has historically struggled a bit at home, but not during this period, averaging 58.83 from 27 home Tests.
Amla has exceptional stats in India (average 132.83 in five Tests), UAE (78.40), England (75.70) and Australia (57.81), but on the tour to the West Indies in 2010, he averaged 20.33 from six innings. Overall, though, there's little to separate the two.
Shivnarine Chanderpaul is up there too, followed by Graeme Smith, while Jacques Kallis makes it into the top ten despite a poor series against Pakistan.
| Batsman | Tests | Runs | Average | 100s/ 50s |
| AB de Villiers | 32 | 2762 | 64.23 | 7/ 10 |
| Hashim Amla | 31 | 3100 | 63.26 | 11/ 11 |
| Shivnarine Chanderpaul | 20 | 1641 | 63.11 | 5/ 8 |
| Graeme Smith | 32 | 3126 | 57.88 | 11/ 12 |
| Alastair Cook | 36 | 3440 | 57.33 | 12/ 14 |
| Thilan Samaraweera | 19 | 1708 | 56.93 | 5/ 8 |
| Sachin Tendulkar | 26 | 2472 | 54.93 | 8/ 10 |
| Misbah-ul-Haq | 34 | 2605 | 53.10 | 4/ 22 |
| Jacques Kallis | 31 | 2496 | 53.10 | 11/ 7 |
| Kumar Sangakkara | 21 | 2025 | 51.92 | 7/ 10 |
South Africa's bowling effort has been led by Dale Steyn, who has missed only two overseas Tests during this period. In 30 matches, he has taken 140 wickets at an average of less than 25. Like the batsmen, he has been very consistent too, averaging 18.13 in the West Indies, 20.23 in five Tests in India, and less than 29 in Australia, Pakistan and New Zealand. Surprisingly, his average in England is 31.65, while he has done reasonably well on the unresponsive pitches of the UAE, averaging 32.78.
The addition of Vernon Philander has been a huge boost to the attack as well: in ten overseas Tests he averages 22, and his control over line and length were on display even on the unresponsive pitches of the UAE. Morne Morkel has taken 99 overseas wickets at 31.97 during this period, and Imran Tahir's incisive spells in Dubai means South Africa have an attacking spinner in their ranks as well, an area which has generally been a weakness for them. Sixteen wins and five defeats is testimony to just how well they've put those resources to use in overseas conditions.
| Bowler | Tests | Wickets | Average | Strike rate | 5WI/ 10WM |
| Ryan Harris | 11 | 54 | 20.75 | 42.8 | 3/ 0 |
| Vernon Philander | 10 | 43 | 22.00 | 48.0 | 3/ 1 |
| Dale Steyn | 30 | 140 | 24.73 | 45.2 | 7/ 2 |
| Mohammad Asif | 12 | 55 | 25.50 | 51.5 | 3/ 0 |
| Saeed Ajmal | 30 | 159 | 26.54 | 60.1 | 9/ 4 |
| Abdur Rehman | 17 | 79 | 26.93 | 64.3 | 2/ 0 |
| Tim Southee | 13 | 49 | 27.83 | 52.2 | 3/ 1 |
| Shakib Al Hasan | 11 | 43 | 28.00 | 58.2 | 4/ 0 |
| Shane Watson | 28 | 41 | 28.02 | 62.0 | 3/ 0 |
| Graeme Swann | 25 | 128 | 28.19 | 59.8 | 10/ 2 |
| Zaheer Khan | 16 | 68 | 29.01 | 50.3 | 2/ 1 |
S Rajesh is stats editor of ESPNcricinfo. Follow him on Twitter