Chalk and Cheese: a look at the two halves of Test innings
An analysis of batting performances in the two halves of a Test innings
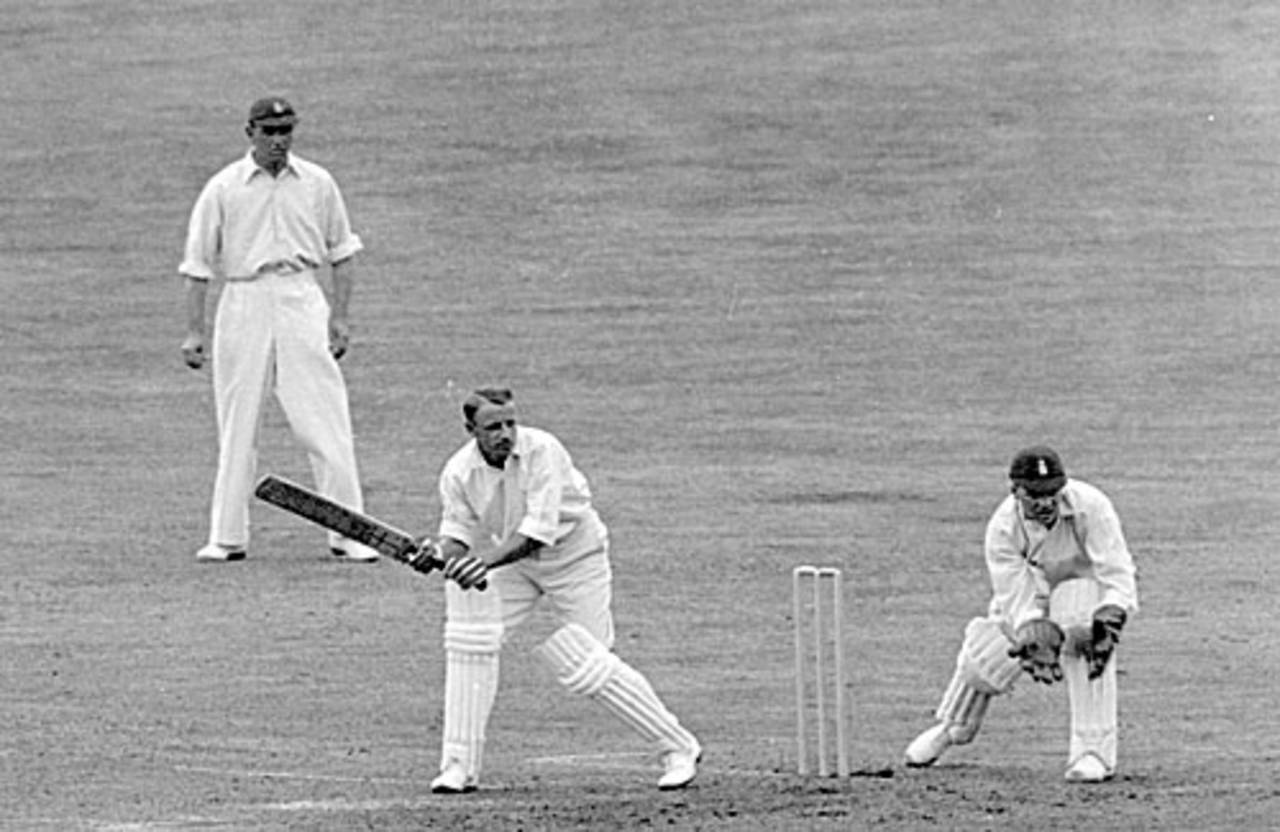
Bradman's 270 was rated the best Test innings by Wisden • Getty Images
It is the responsibility of the first 6 batsmen in a Test innings to score the required runs and the low order batsmen, normally the bowlers, to provide support. There are times when it happens the other way around. The low order batsmen score more runs than the top order. There is an inherent charm and excitement in these innings. Often these also turn out to be match-winning innings. More often than not one of the top order batsman stays on to shepherd the late order. It could also be that these are true cases of innings revival controlled by genuine late order batsmen. In this article I have taken a comprehensive look at such innings.
I may be wrong. However there is only one innings in test cricket in which, for strategic reasons, a captain sent his entire low order first on an a "gluepot" of a wicket, and then he himself came on to play one of the greatest Test innings ever. This match is discussed later. So this is the only innings in which the late order was expected to outscore the top order.
First some summary facts. These are current up to match no 1965, the second Pakistan-Australia match.
Number of innings played: 6187 (Maximum-7860)
Number of innings played in which the late order (wkts 6-10) has out-performed the top order (wkts 1-5).
All tests: 1431 (in 6187 innings - 0.23 times per innings).
Overall there has been an average such occurrence of around 0.23 per innings (slightly below once a test). There have been distinct moves away from this mean value of 0.23. During the pre-WW1 period, at times of uncovered pitches, wide disparity in batsmen techniques, "gentlemen" teams playing etc., the low order had to come to the rescue of the top order more often, around 0.26 times per innings. Then came the batting era, with top batsmen playing, the move was in the other direction. Either side of the WW2, the number oscillated around 0.20 per innings. Bradman, Hammond, Headley before and Hutton, the three Ws, Sobers, after. During the period 1970-1989, the figure picked up to 0.24, just above the mean. Then from 1990 to 2010, the figure has oscillated at around the mean of 0.24. Even when I split up the period into two halves, the figure has not changed. It can thus be concluded that barring the Pre-WW1 and either side of WW2, the frequency has remained at around 0.24, during the past 40 years.
The complete table of 1431 innings is available for view, import and analysis for users. The table is in reverse chronological order. To view/down-load the complete table, please click/right-click here.
How do we view the information in a summary form in this analysis. I have created three summary tables for viewing. In all tables I have also shown the highest scorer and the batting position he batted in to give an idea of who coordinated the revival.
The first is a table ordered on the ratio between the second half runs and first half runs. For the selected innings this value is 1.00 or more. In this table I have selected only innings in which this ratio is 4.00 or more. There is no rocket science in this number. It is a high enough number to limit the number of table entries to a reasonable number. Also we are pushing up the bar. Anyhow this is only a cut-off for display. By definition these will be innings such as 25 for 5 recovering to 200 all out or 100 for 5 recovering to 400+ for 8 and so on. It is more likely we have low scoring innings in this table. Let us look at the table.
Year MtId Bow Bat R 5Wkts Final <2nd Half> Highest Score
e Score Score Runs To1Hf Runs(BP) Batsman
s
Before any reader comes in with his comment, let me confess that this is an odd table. The ratio depends on how quickly the first 5 wickets have fallen rather than on how many runs were scored by the last 5 wickets. However, having set out the base methodology, I did not want to exclude any innings based on an artificial lower limit for the innings size.
The highest ratio reached is 15.33 when India recovered from 6 for 5 to 98 all out, assisted by Hazare. Readers should remember that if the sixth wicket had fallen soon after, India might not have reached 26, the record low total of New Zealand. The bowling attack was a fearsome one, viz., Trueman, Bedser, Laker and Lock. Pakistan's recovery, controlled by Moin Khan, is lot more substantial, with a ratio of 13.13. However the innings which catches one's eye is the Australian recovery from 32 for 5 to 323 all out, orchestrated by Clem Hill's 188, which is in the top-10 of the Wisden-100 innings table. Recent recoveries have been led by the two keepers, Khaled Mashud and Taibu.
It can also be seen that very few of these tests are likely to be won, considering the low-score nature of recovery. Hill's innings was one of the successful ones and Symonds, which was in the second innings. 18 out of 76 have resulted in wins.
To view/down-load the complete table, please click/right-click here.
The second is a table ordered on the number of runs added by the last 5 wickets during the selected innings. In this table I have selected only innings in which the runs added are 300 or more. By definition these will be innings such as 150 for 5 recovering to 475 all out or 300 for 5 moving on to 700+ for 8 and so on. It is more likely we have high scoring innings in this table. Let us look at the table.
Year MtId Bow Bat R 5Wkts Final <2nd Half> Highest Score
e Score Score Runs To1Hf Runs(BP) Batsman
s
This is a more interesting table since it is ordered on the number of runs added.
At the top of the table, Imtiaz Ahmad, batting at no.8, scored 205 and helped Pakistan recover from 87 for 5 to 561 all out.
The next match is an all-time classic. The innings by Bradman was determined to be the best ever Test innings in the Wisden-100 exercise. Australia's 200 for 9 was countered by England with 76 for 9, on a diabolical pitch. Then Bradman countered by sending his low order batsman, to let the pitch dry out. These batsmen promptly lost their wickets, but consumed valuable time. Bradman walked in and scored 270 to take Australia to 564 and a comfortable win. It was a tribute to Bradman the tactician as much as Bradman the batsman.
The most intriguing innings is by Wasim Akram who scored 257 at no.8 and took Pakistan from 176 for 5 to 553 all out in the company of Saqlain Mushtaq.
More tests in this table are won since the recovered innings score is almost always in excess of 400. 28 out of 59 have resulted in wins.
To view/down-load the complete table, please click/right-click here.
The third is a table ordered by the final score reached, but with a different criteria for selection. I have selected only innings in which the ratio is 2.50 or more and 200 or more runs are added by the last 5 wickets. This is done to ensure that we get a representative population of truly great late order batting performances. By definition these will be innings such as 150 for 5 recovering to 450 all out but not 7 for 5 to 70 all out nor 375 for 5 to 760 for 7. This table is likely to contain the really relevant innings. Let us look at the table.
Year MtId Bow Bat R 5Wkts Final <2nd Half> Highest Score
e Score Score Runs To1Hf Runs(BP) Batsman
s
Truly a list of the greatest recoveries ever. We make our acquaintance with Bradman, Imtiaz and Hill again. We should admire the recent double hundred of Thorpe. Gavaskar's 236*, against Marshall, Roberts, Holding and Davis, at the unusual batting position of 4, must compete with his swan song classic of 97 for being considered his best innings. Symonds has played two such innings.
Since this test balances the ratio and runs added measures, the number of tests won in these matches is also likely to be on the higher side. 34 teams have won out of 87.
To view/down-load the complete table, please click/right-click here.
I would appreciate if readers download the master table, import into an Excel sheet and come out with nice nuggets of information including country-wise numbers. These would be published with due acknowledgement.
The one thing that strikes me at the outset is that there are very few such recoveries by India, barring the one led by Gavaskar. I am not sure whether this indicates a lack of quality of the Indian late order batsmen or the strength of top order batting or a combination of both. Surprisingly, West Indies and Pakistan have many such recoveries.
Anantha Narayanan has written for ESPNcricinfo and CastrolCricket and worked with a number of companies on their cricket performance ratings-related systems