England's best chance to rewrite record
After completely dominating India at home, England will look to seal an elusive ODI series triumph in India against a highly-depleted side
Madhusudhan Ramakrishnan
Oct 13, 2011, 11:22 AM
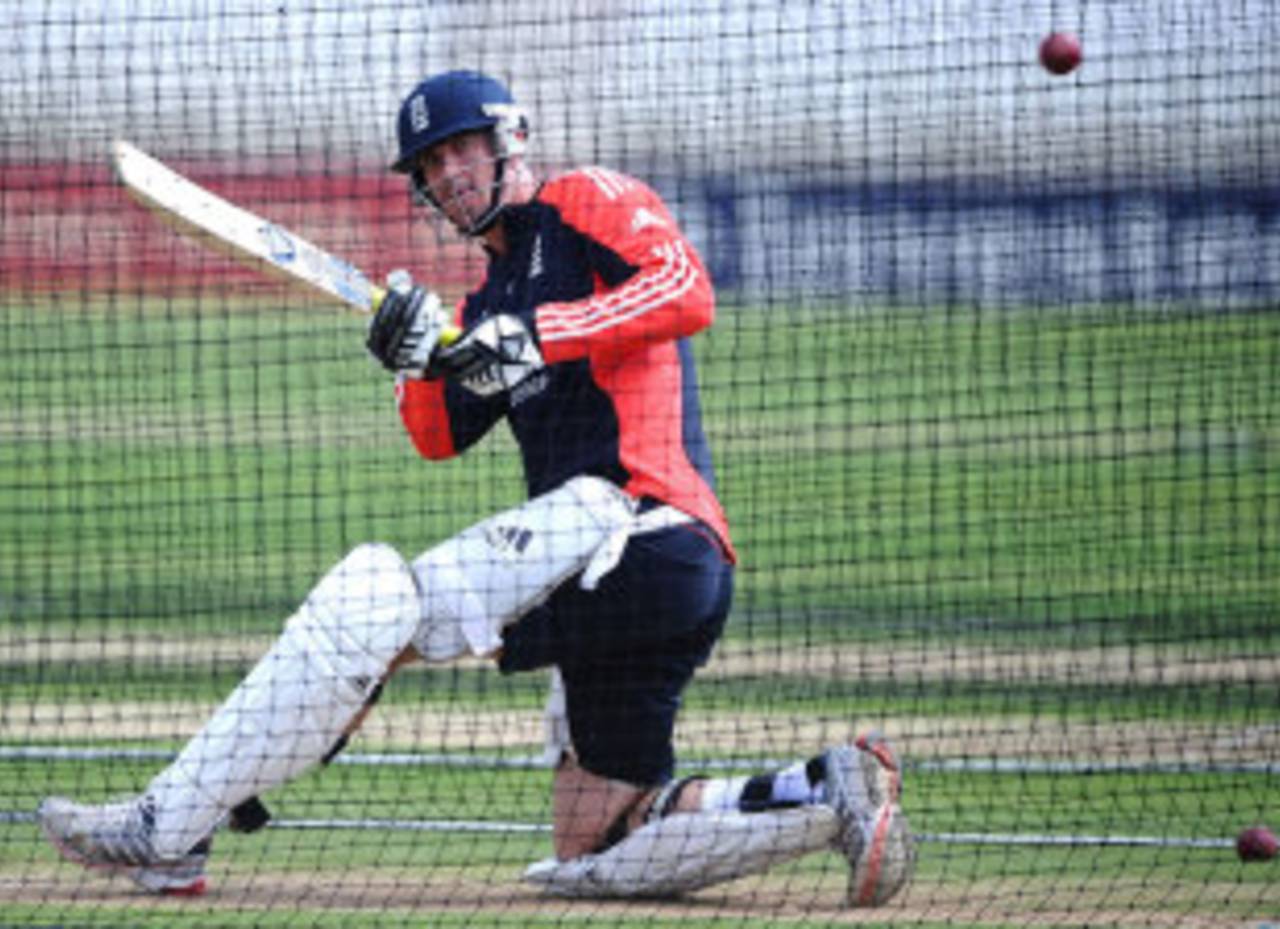
Kevin Pietersen, who has struggled in ODIs recently, is England's second-highest run-getter in the subcontinent • AFP
Before the Test series in 2001, Steve Waugh aptly labelled India as his 'final frontier' because Australia had failed to win a Test series in India for 32 years. Considering that England are yet to win a single ODI series in India since 1984, Alastair Cook may be prompted to describe India similarly. England, who have been outstanding in Tests in the last few years, have failed to transfer the form to the ODI arena. Their performances in the limited-overs format have been highly erratic. However, in between two 6-1 defeats to Australia in 2009 and 2011, they won six ODI series including two tightly-fought series against Pakistan and South Africa. The story was different, however, in the World Cup in the subcontinent, where they played exceptionally to defeat South Africa and tie the game against India, but shockingly lost to both Ireland and Bangladesh. Following a crushing ten-wicket loss in the quarter-final, England reversed their ODI fortunes by winning two home series against Sri Lanka and India.
Since 2000, India boast an outstanding ODI record at home losing only four of 19 bi-lateral series (minimum three matches in series). However, given their recent domination of India and the fact that the hosts are plagued with injuries, this definitely represents England's best chance to grab an elusive series win.
Overall, India have the edge in head-to-head clashes winning 38 matches to England's 33. India have by far been the better side in matches played at home since 2000 winning 14 and losing just four. They have also dominated England in global tournaments winning four of the previous five meetings. England, however, have the better win-loss record (10-6) in ODIs played since 2000 in England. The extent of each team's dominance in home matches is reflected in the average difference and run-rate difference factors. While England have a positive run-rate difference of 0.42 and average difference of 9.65 in home ODIs, the corresponding figures are 0.40 and 10.65 in favour of India in matches played in India and neutral venues since 2000. Since 2007, the teams have played each other 18 times with England winning seven and losing eight. While England won both the home series by margins of 4-3 and 3-0, India cantered to a 5-0 win in their home series. In the only other match played between the two sides during the World Cup in Bangalore, the teams played out their first ever tie in head-to-head contests. Perhaps the best indicators of the close nature of recent ODIs are the extremely low values of the average difference (0.87) and run-rate difference (0.13).
| Venue | Played | Won | Lost | Bat avg | Bowl avg | RR | ER | Avg diff | RR diff |
| in England (overall) | 33 | 18 | 11 | 37.49 | 31.61 | 5.12 | 4.77 | 5.88 | 0.35 |
| in India (overall) | 35 | 13 | 21 | 29.54 | 35.73 | 5.08 | 5.27 | -6.19 | -0.19 |
| In England (since 2000) | 19 | 10 | 6 | 41.22 | 31.53 | 5.76 | 5.34 | 9.69 | 0.42 |
| In India & neutral venues (since 2000) | 21 | 4 | 16 | 27.13 | 37.78 | 5.19 | 5.59 | -10.65 | -0.40 |
| Overall since 2007 | 18 | 7 | 8 | 36.93 | 36.06 | 5.86 | 5.73 | 0.87 | 0.13 |
England have improved considerably in their away record in most countries since 2007. Between 2000 and 2006, they failed to win a single ODI in Australia and had a similar record in Sri Lanka. However, since 2007, they have won four ODIs in Australia and three in Sri Lanka. In the same period, they also have a winning record in South Africa and West Indies. India, though, has proved to be a major hurdle for England. Between 2000 and 2006, they had a 4-9 record in ODIs in India but since 2007, they have lost five and tied one game. In the 2008 series, they went down 5-0 in the first five matches before the last two games were abandoned. When the ODI performance since 2000 in various countries is compared, their struggles in the subcontinent are evident. Their average difference and run-rate difference are the worst in Sri Lanka (-13.81 and -0.88). The corresponding numbers in India (-9.68 and -0.30) in the same period are also quite discouraging. England, who have won seven of their last eight bi-lateral series (three matches or more), will definitely seek to erase their abysmal record in India in the upcoming series.
| Opposition | Matches | W/L ratio | Bat avg | Bowl avg | Bat RR | Bowl RR | Avg diff | RR diff |
| Australia | 19 | 0.26 | 25.47 | 38.07 | 4.78 | 5.29 | -12.60 | -0.51 |
| India | 19 | 0.28 | 27.28 | 36.96 | 5.26 | 5.56 | -9.68 | -0.30 |
| Sri Lanka | 10 | 0.42 | 19.17 | 32.98 | 3.68 | 4.56 | -13.81 | -0.88 |
| New Zealand | 10 | 0.50 | 26.82 | 32.89 | 4.56 | 5.25 | -6.07 | -0.69 |
| South Africa | 15 | 0.62 | 31.68 | 29.20 | 4.93 | 4.90 | 2.52 | 0.03 |
| West Indies | 11 | 1.50 | 31.25 | 33.57 | 5.35 | 5.46 | -2.32 | -0.11 |
Kevin Pietersen, who was not part of the England team that beat India 3-0 in the home ODI series, has had a horrendous run in ODIs in the last two years. He has managed only two fifties and averages just 22.86 since the beginning of 2009. However, among England batsmen, he has the best record in the subcontinent. He has scored over 1000 runs at an average of 41.75 and a strike rate of 88.98 with his only century coming in the last series in India. Jonathan Trott, on the other hand, has not had any issues whatsoever with his batting form. Since his debut, he has been England's model of consistency in both Tests and ODIs. In just 35 matches, he has scored three centuries and 14 fifties including five half-centuries in the World Cup.
Jonny Bairstow, who scored a crucial 21-ball 41 on debut in England's win over India in Cardiff, cracked a century in the tour game to boost his chances of making the XI. Alastair Cook, who recently took over the ODI captaincy, has had a remarkable turnaround in ODIs. Between his debut and the end of 2008, he had an average of 30.52 and a strike rate under 70. However, since 2009, he averages 56.63 with a superb strike rate of 94.53.
| Batsman | Avg/SR (subcontinent since 2000) | 100/50 (subcontinent since 2000) | Avg/SR (overall since 2009) | 100/50 (overall since 2009) |
| Kevin Pietersen | 41.75/88.98 | 1/8 | 22.86/85.32 | 0/2 |
| Jonathan Trott | 60.28/80.84 | 0/5 | 51.48/78.35 | 3/14 |
| Alastair Cook | 35.77/70.61 | 0/3 | 56.63/94.53 | 1/5 |
| Ian Bell | 29.09/73.43 | 0/3 | 31.20/76.89 | 0/4 |
| Ravi Bopara | 33.40/72.13 | 0/3 | 32.55/79.18 | 0/2 |
Yuvraj Singh, the player of the tournament in the World Cup and the leading run-getter in the home series against England in 2008, was one of the casualties on the ill-fated England tour. Sachin Tendulkar and Virender Sehwag, also nursing injuries, will be missing from India's batting line-up. All three have scored over 1000 runs in ODIs against England and their absence will be a major blow to India who are seeking a quick reversal in fortunes after the drubbing in England. MS Dhoni and Suresh Raina, who had a very ordinary time in the Tests in England, found some form in the ODIs, and will undoubtedly be the key in India's middle order. Virat Kohli and Gautam Gambhir, who are second and third on the list of India's leading run-getters in the last two years, will be crucial at the top of the order in the absence of Sehwag and Tendulkar.
| Batsman | Matches | Runs | Average | SR | 100/50 |
| MS Dhoni | 66 | 2350 | 54.65 | 83.27 | 3/16 |
| Gautam Gambhir | 50 | 1911 | 45.50 | 91.39 | 4/12 |
| Virat Kohli | 59 | 2188 | 44.65 | 83.57 | 6/15 |
| Suresh Raina | 70 | 1701 | 36.19 | 97.92 | 1/9 |
| Parthiv Patel | 14 | 477 | 36.69 | 82.52 | 0/4 |
India has always been a challenging venue for overseas bowlers. The flat tracks and small size of most venues make it virtually impossible for any bowler to rein in the scoring rate. Australia's bowlers have been the exception in ODIs played since 2007. Their pace bowlers have picked up 78 wickets at an average of 32.83. In contrast, England's fast bowlers, however, have struggled picking up 23 wickets at an average of 48.82. Tim Bresnan, another in-form bowler for England in the home series against India, impressed with a five-wicket haul in the tied game in the World Cup in Bangalore. Jade Dernbach's pace variations could be handy on pitches that are generally expected to favour the batsmen. The presence of Graeme Swann and Samit Patel does add an extra dimension to the squad although Indian batsmen are less likely to be troubled by spinners in home conditions.
Zaheer Khan, India's best bowler in the World Cup, missed the whole of the England tour with an injury sustained in the first Test. In his absence, the Indian bowling hardly posed a threat to England in the Tests and ODIs. In the upcoming series, Praveen Kumar will lead a highly-inexperienced bowling attack. Sreenath Aravind, who had the most expensive bowling analysis in the Champions League Twenty20, is one of the new faces in the squad along with Varun Aaron and Rahul Sharma. The England batsmen did face a few problems against R Ashwin and Ravindra Jadeja in the recent series and are likely to be tested even more on slow tracks that will favour the spinners.
The Rajiv Gandhi stadium in Hyderabad, the venue for the first ODI, has hosted one day-night game so far. In 2009, faced with a huge target of 351, Sachin Tendulkar scored a remarkable 175 but failed to prevent Australia from sneaking a three-run win. Among the other venues, Mohali remains the one that has clearly favoured the team batting first. In nine day-night matches at the venue, six have been won by the team batting first. The record of chasing teams has been better in Mumbai, Kolkata and Delhi. Pace bowlers have found the pitch in Mohali most conducive (104 wickets at 26.77) and on the other hand, spinners have been most successful in Mumbai (23 wickets at 26.82).
| Venue | Matches | Wins/losses (batting first) | Avg (1st inns) | Avg (2nd inns) | RR (1st inns) | RR (2nd inns) | Pace (wickets/avg) | Spin (wickets/avg) |
| Mumbai | 4 | 1/3 | 30.74 | 31.44 | 4.97 | 4.80 | 32/35.40 | 23/26.82 |
| Kolkata | 4 | 1/2 | 33.73 | 49.76 | 5.34 | 5.51 | 26/37.42 | 10/53.10 |
| Mohali | 9 | 6/3 | 28.60 | 27.28 | 5.12 | 5.09 | 104/26.77 | 28/41.28 |
| Delhi | 5 | 1/4 | 27.16 | 35.48 | 4.78 | 4.68 | 36/31.69 | 29/31.68 |