Cook, spinners make the difference
England's remarkable comeback series win was possible primarily because of the exploits of Alastair Cook and the two lead spinners
Madhusudhan Ramakrishnan
Dec 18, 2012, 4:19 PM
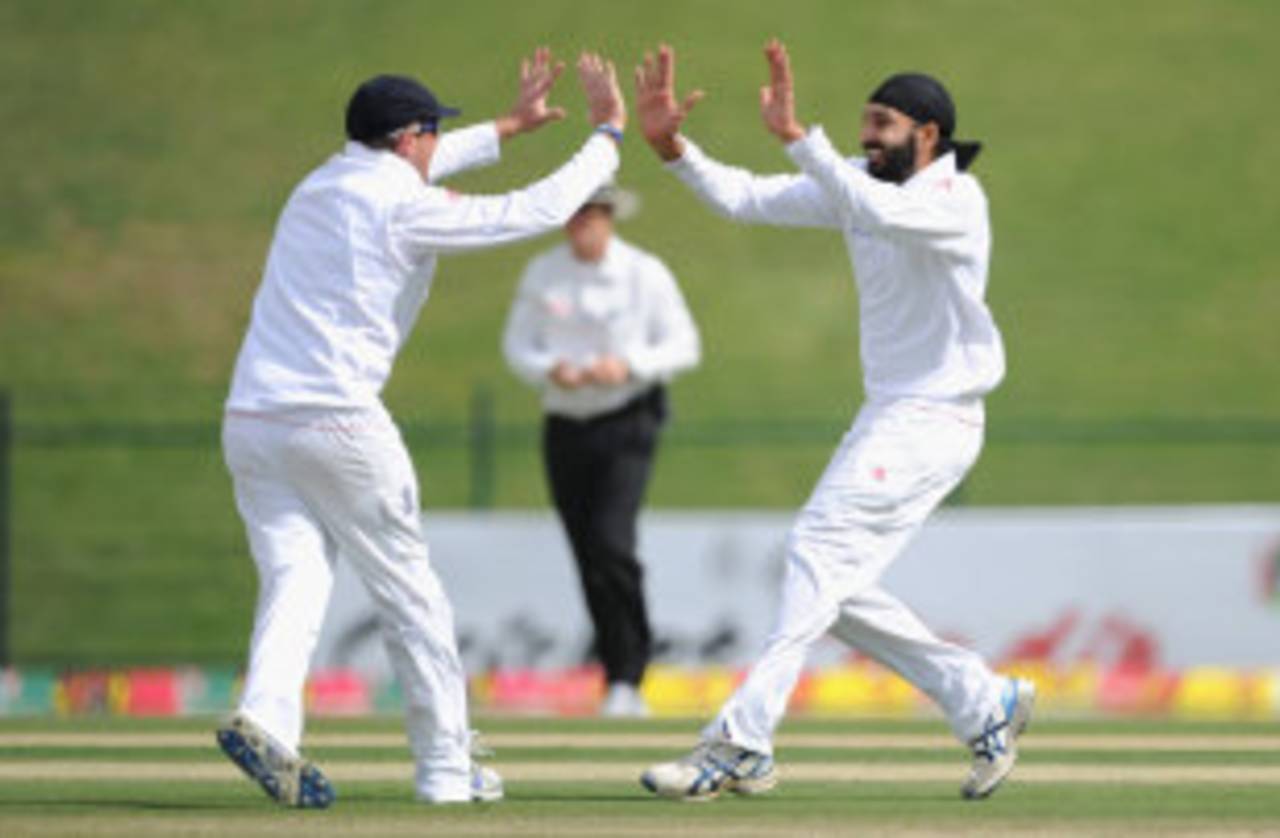
Graeme Swann and Monty Panesar picked up 37 wickets in the series at an average of 25.70 • Getty Images
A second come-from-behind series win
When England completed a 2-1 series win after the tame draw in the fourth Test in Nagpur, their performance bore an uncanny similarity to the display on the 1984-85 tour, when they last won a Test series in India. In that series too, England had turned around a 1-0 deficit (eight-wicket loss in Mumbai) by winning Tests in Delhi and Chennai.
When England completed a 2-1 series win after the tame draw in the fourth Test in Nagpur, their performance bore an uncanny similarity to the display on the 1984-85 tour, when they last won a Test series in India. In that series too, England had turned around a 1-0 deficit (eight-wicket loss in Mumbai) by winning Tests in Delhi and Chennai.
This time around, England staged a remarkable comeback following a nine-wicket defeat in the first Test in Ahmedabad. Despite losing an important toss on a difficult wicket in Mumbai, the visitors produced a brilliant all-round performance to level the series with a ten-wicket win. England followed up this victory with a seven-wicket win in Kolkata and by winning the series, became the only team to achieve a comeback series win in India twice (previously in 1984-85).
England's win was largely because of the efforts of Alastair Cook and the two lead spinners. While Cook held the batting together with three centuries in the first three Tests, Graeme Swann and Monty Panesar picked up a total of 37 wickets and outperformed the Indian spin duo of R Ashwin and Pragyan Ojha.
Barring the one collapse in the first innings in Ahmedabad, England were extremely consistent with the bat. On a Mumbai track which was extremely favourable to spinners, Cook and Kevin Pietersen came up with brilliant knocks to lay the foundation for England's win.
Across the four Tests, England scored more runs than India and averaged much higher (40.59 to 33.77). The visitors were ahead on the century count (six to four) and also managed more century partnerships (seven to four). The England bowlers picked up one more wicket than the Indian bowlers (58 to 57) and ended with three five-wicket hauls, one more than the home bowlers could manage.
| Team | Runs | Bat avg | 100/50 | 100/50 stands | Wickets taken | 5WI/10WM |
| England | 2314 | 40.59 | 6/8 | 7/7 | 58 | 3/1 |
| India | 1959 | 33.77 | 4/8 | 4/9 | 57 | 2/0 |
England spinners dominate
In the series against Pakistan earlier this year, England did not pick Monty Panesar for the first Test in Dubai which they lost by ten wickets. Immediately after being recalled for the second Test, Panesar picked up 14 wickets in the next two Tests but England failed to capitalise going on to lose the series 3-0. The pattern repeated itself as Panesar, who was surprisingly left out of the starting line-up in Ahmedabad, came back superbly in Mumbai and ended with a ten-wicket match haul including the wicket of Sachin Tendulkar twice.
In the series against Pakistan earlier this year, England did not pick Monty Panesar for the first Test in Dubai which they lost by ten wickets. Immediately after being recalled for the second Test, Panesar picked up 14 wickets in the next two Tests but England failed to capitalise going on to lose the series 3-0. The pattern repeated itself as Panesar, who was surprisingly left out of the starting line-up in Ahmedabad, came back superbly in Mumbai and ended with a ten-wicket match haul including the wicket of Sachin Tendulkar twice.
Panesar and Swann (20 wickets) combined to finish the series with 37 wickets at an average of 25.70. In contrast, the Indian spin pair of Ashwin and Ojha ended with 34 wickets at a much higher average of 39.82.
India's overwhelming dominance on the spin front had been a major factor in their impressive home record (five series defeats in 28 years). In the 2004 series against Australia, when India last suffered a home series defeat (2-1), the visiting spinners, led by Shane Warne, ended with a better average but picked up far fewer wickets (25) than the Indian slow bowlers (60 wickets). In each of the three previous series defeats (2000, 1987 and 1984-85), the Indian spinners finished with a higher number of wickets than the visiting spinners. But in the recent series against England, the trend was reversed; not only did the England spinners finish with nearly the same number of wickets, they were also far more potent finishing with a much better strike rate than their Indian counterparts (64.5 and 94.9 respectively).
| Series (winner) | Win margin | Indian spinners (wickets/avg) | Indian spinners (strike rate/five-fors) | Visiting spinners (wickets/avg) | Visiting spinners (strike rate/five-fors) |
| 2012 (England) | 2-1 | 43/40.62 | 94.9/3 | 39/28.61 | 64.5/3 |
| 2004 (Australia) | 2-1 | 60/24.86 | 47.6/6 | 25/23.36 | 44.9/2 |
| 2000 (South Africa) | 2-0 | 21/28.14 | 71.0/1 | 7/22.42 | 60.8/1 |
| 1987 (Pakistan) | 1-0 | 43/34.58 | 100.1/2 | 35/36.85 | 82.6/2 |
| 1984-85 (England) | 2-1 | 42/38.28 | 90.5/2 | 27/46.37 | 114.8/0 |
Captain leads the way
England came into the series following a tough home series defeat against South Africa which cost them their No. 1 ranking. Cook took over the captaincy from Andrew Strauss, who retired after the defeat at Lord's. Under severe pressure facing a huge deficit in Ahmedabad, Cook responded magnificently scoring 176 but failed to prevent a nine-wicket loss. But he carried his excellent form into the Mumbai and Kolkata Tests scoring centuries in both the games. In the process, he became only the fifth player to score three-plus centuries in a series in India.
England came into the series following a tough home series defeat against South Africa which cost them their No. 1 ranking. Cook took over the captaincy from Andrew Strauss, who retired after the defeat at Lord's. Under severe pressure facing a huge deficit in Ahmedabad, Cook responded magnificently scoring 176 but failed to prevent a nine-wicket loss. But he carried his excellent form into the Mumbai and Kolkata Tests scoring centuries in both the games. In the process, he became only the fifth player to score three-plus centuries in a series in India.
Cook also set a record for the most deliveries (1,285) faced by a visiting captain in a series in India and ended the four-match series with a total of 562 runs at an average of 80.28. Among visiting captains, only Clive Lloyd (636 runs in 1974-75) and Kim Hughes (594 runs in 1979-80) have scored more runs in a series than Cook. But Cook's average is second to Lloyd's 82.66 in the 1983-84 series which West Indies won 3-0. Interestingly, four of the top five (Lloyd twice) are left-handers.
| Batsman | Series | Winner | Innings | Runs | Avg | 100/50 |
| Clive Lloyd (WI) | 1974-75 | West Indies | 9 | 636 | 79.50 | 2/1 |
| Kim Hughes (Aus) | 1979-80 | India | 12 | 594 | 59.40 | 1/5 |
| Alastair Cook (Eng) | 2012-13 | England | 8 | 562 | 80.28 | 3/0 |
| Alvin Kallicharran (WI) | 1978-79 | India | 10 | 538 | 59.77 | 1/3 |
| Clive Lloyd (WI) | 1983-84 | West Indies | 8 | 496 | 82.66 | 2/2 |
Cook, the leading run-getter for England in the series, was largely untroubled by pace or spin. He was dismissed only once by the fast bowlers (in the final Test in Nagpur) and averaged 140 against them. Against spinners, Cook averaged 84.40 and was dismissed five times (four times by Ashwin).
Pietersen, whose stunning 186 set up England's win in Mumbai, was troubled again by left-arm spin falling to Ojha three times and twice to Ravindra Jadeja. But he maintained a decent average (42.14) and scored at 3.64 runs per over off the spinners.
Jonathan Trott, who scored his first century against India in the Nagpur Test, had a mixed series. He was dismissed seven times by spinners and fell most often to Ojha (four dismissals and average of 22).
Matt Prior's batting was a huge boost for England in this series. He scored a fairly decent clip off both pace bowlers and spinners and averaged 69.0 and 47.25 against them respectively.
Ian Bell's series started horribly with a first-ball dismissal in the first innings in Ahmedabad before batting much better after returning for the third Test in Kolkata. Bell's average against the fast bowlers (15.50) was much lower than his corresponding number against the spinners (70.50).
| Batsman | Pace (avg/dismissals) | Pace (scoring rate/balls per dismissal) | Spin (dismissals/avg) | Spin (scoring rate/balls per dismissal) |
| Alastair Cook | 140.00/1 | 2.25/372.0 | 84.40/5 | 2.77/182.6 |
| Kevin Pietersen | -/0 | 2.55/- | 42.14/7 | 3.64/69.3 |
| Jonathan Trott | -/0 | 2.91/- | 34.42/7 | 2.34/88.0 |
| Matt Prior | 69.00/1 | 3.18/130.0 | 47.25/4 | 2.70/105.0 |
| Ian Bell | 15.50/2 | 3.32/28.0 | 70.50/2 | 2.17/194.5 |
Inconsistency plagues Indian batting
It all began so well for India in the first Test. Cheteshwar Pujara scored his first double-century while Virender Sehwag hit his first Test century in nearly two years. But from then on the batting plummeted. Pujara was the stand-out batsman scoring two centuries in the first two Tests. He was not dismissed even once by the fast bowlers but fell four times to the spinners (average 66.75). Sehwag was impressive against the pace bowlers but was dismissed five times by spinners (average 21.80). Although he had an excellent scoring rate (5.58) against the slow bowlers, his balls-per-dismissal figure was far too low (23.40). Gambhir, who fell three times each to pace bowlers and spinners, was once again guilty of playing away from his body. Ashwin turned out to be one of India's most consistent batsmen in the series ending with 243 runs at an average of 60.75.
It all began so well for India in the first Test. Cheteshwar Pujara scored his first double-century while Virender Sehwag hit his first Test century in nearly two years. But from then on the batting plummeted. Pujara was the stand-out batsman scoring two centuries in the first two Tests. He was not dismissed even once by the fast bowlers but fell four times to the spinners (average 66.75). Sehwag was impressive against the pace bowlers but was dismissed five times by spinners (average 21.80). Although he had an excellent scoring rate (5.58) against the slow bowlers, his balls-per-dismissal figure was far too low (23.40). Gambhir, who fell three times each to pace bowlers and spinners, was once again guilty of playing away from his body. Ashwin turned out to be one of India's most consistent batsmen in the series ending with 243 runs at an average of 60.75.
Virat Kohli endured an ordinary run in the first three Tests before ending on a high with a century in Nagpur. He ended with nearly equal averages against pace and spin although he fell more often to the slow bowlers (four times). MS Dhoni also had a disappointing run till the Nagpur Test when he scored 99 in the first innings. He was dismissed three times by both fast bowlers and spinners but managed a higher average against the spinners.
Sachin Tendulkar had a terrible series with just one half-century. He was dismissed twice each by James Anderson, Swann and Panesar. Anderson, who went on to dismiss Tendulkar in the first innings in Kolkata and Nagpur, is now on top of the list of bowlers who have dismissed Tendulkar most often (nine times).
| Batsman | Pace (avg/dismissals) | Pace (Scoring rate/balls per dismissal) |
Spin (dismissals/avg) |
Spin (scoring rate/balls per dismissal) |
| Cheteshwar Pujara | -/0 | 3.53/- | 66.75/4 | 2.47/161.75 |
| Virender Sehwag | 72.00/2 | 5.30/81.50 | 21.80/5 | 5.58/23.40 |
| Gautam Gambhir | 36.66/3 | 2.53/86.66 | 47.00/3 | 2.67/105.33 |
| R Ashwin | 111.0/1 | 3.56/187.0 | 44.00/3 | 3.11/84.66 |
| Virat Kohli | 30.00/2 | 2.20/81.50 | 32.00/4 | 2.06/93.00 |
| MS Dhoni | 26.33/3 | 2.20/71.66 | 37.33/3 | 2.52/88.66 |
| Sachin Tendulkar | 24.00/2 | 4.80/30.00 | 16.00/4 | 2.35/40.75 |
As the series progressed, Cook and Nick Compton turned out to be more prolific than the Indian pair of Sehwag and Gambhir, who started with a century stand in the first innings in Ahmedbad.
Pujara's form meant that India had the better stats for the second-wicket partnership. But this was offset by Tendulkar's poor form. England aggregated 332 runs (average 47.42) for the third wicket while India managed just 88 runs (average 14.66). England also dominated the stats for the fourth and sixth wickets (average 66.00 and 65.80) while India came out on top for the fifth-wicket partnership (average 72.66). Ashwin's excellent batting in the lower middle order meant that India ended with better stats for the seventh wicket (average 45.50) than England (21.40). Only once before (1984-85 series) have England managed more century stands in a Test series in India.
| Partnership wicket | England (Runs/avg) | England (100/50 stands) | India (Runs/avg) | India (100/50 stands) |
| 1 | 493/70.42 | 2/2 | 359/51.28 | 1/2 |
| 2 | 260/37.14 | 1/0 | 279/46.50 | 0/2 |
| 3 | 332/47.42 | 1/1 | 88/14.66 | 0/0 |
| 4 | 396/66.00 | 1/0 | 134/22.33 | 0/1 |
| 5 | 154/30.80 | 0/2 | 436/72.66 | 2/1 |
| 6 | 329/65.80 | 2/0 | 129/21.50 | 0/1 |
| 7 | 107/21.40 | 0/1 | 273/45.50 | 1/1 |
Forgettable series for Tendulkar
One of the biggest reasons for India's batting failures was the poor run of Tendulkar. Since the beginning of the Perth Test in January, he has scored just one half-century averaging just 18.12 in 13 innings. He was also dismissed bowled twice in the England series taking his tally of bowled dismissals to six in 2012. Tendulkar's average of 18.66 is his poorest for a series of four or more matches and the second-lowest for a three-plus match series.
One of the biggest reasons for India's batting failures was the poor run of Tendulkar. Since the beginning of the Perth Test in January, he has scored just one half-century averaging just 18.12 in 13 innings. He was also dismissed bowled twice in the England series taking his tally of bowled dismissals to six in 2012. Tendulkar's average of 18.66 is his poorest for a series of four or more matches and the second-lowest for a three-plus match series.
During his struggles with the tennis elbow problem in 2005-06, Tendulkar averaged 20.75 against England at home and 21.00 in Pakistan. In this series, apart from the one half-century at Eden Gardens, Tendulkar managed just 36 runs in the remaining five innings (average 7.20). His average of 18.66 in the series is the third-lowest for an Indian No. 4 in a Test series (minimum six innings) since 1970.
| Series | Matches | Innings | Runs | Average | 100/50 |
| India in Sri Lanka (2008) | 3 | 6 | 95 | 15.83 | 0/0 |
| England in India (2012) | 4 | 6 | 112 | 18.66 | 0/1 |
| England in India (2005-06) | 3 | 5 | 83 | 20.75 | 0/0 |
| India in Pakistan (2005-06) | 3 | 3 | 63 | 21.00 | 0/0 |
| South Africa in India (1996-97) | 3 | 6 | 166 | 27.66 | 0/1 |
Madhusudhan Ramakrishnan is a sub-editor (stats) at ESPNcricinfo