ESPNcricinfo Awards 2008: Chanders and Sehwag reign
The numbers don't lie. We take a look at the winners and losers of 2008, going purely by the stats
ESPNcricinfo staff
16-Jan-2009
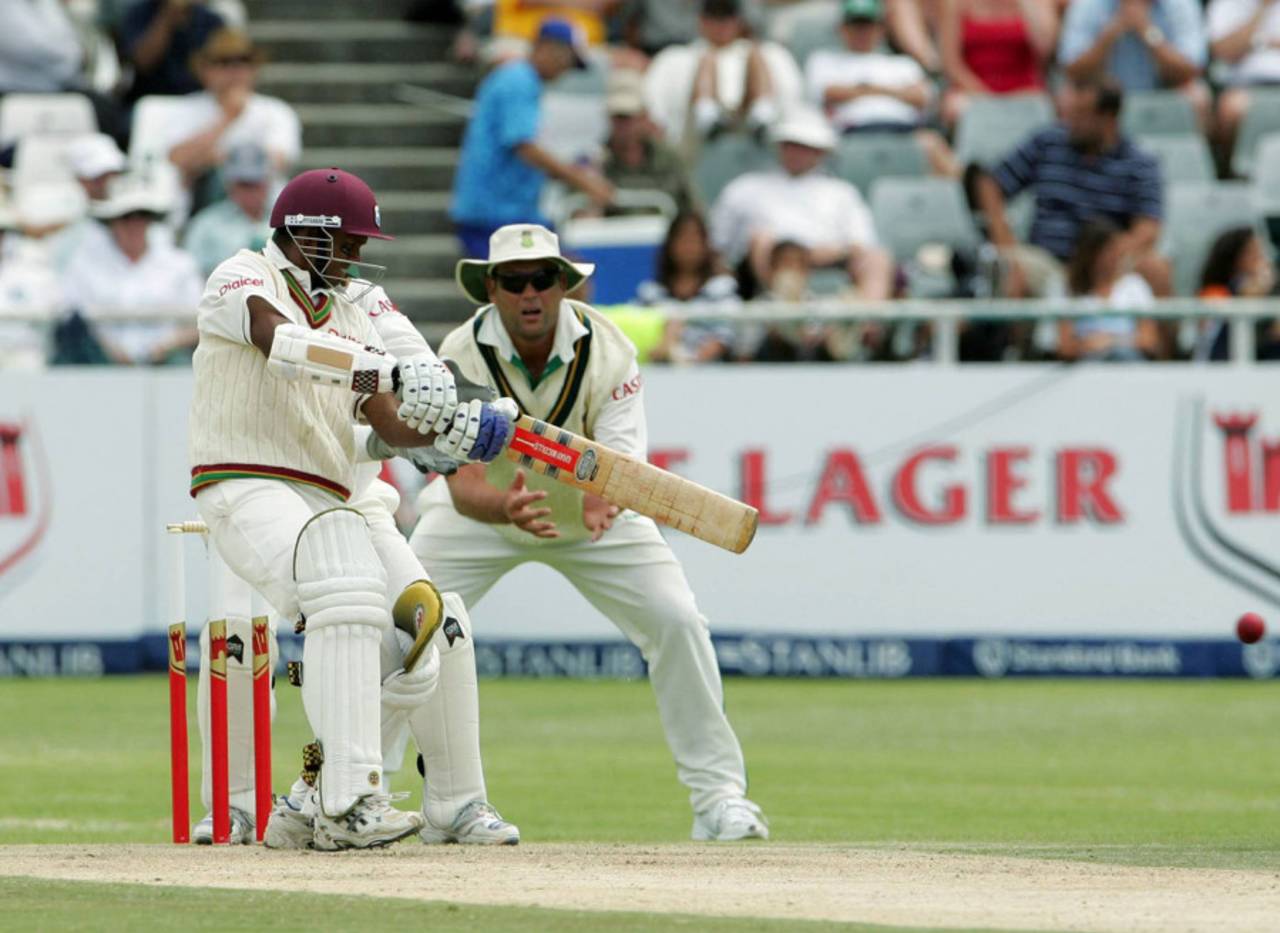
Shivnarine Chanderpaul: immense in Tests and ODIs, all through 2008 • Duif du Toit/Getty Images
The Statsguru Awards are based purely on numbers, from Tests and ODIs in 2008. However, they go beyond the usual stats - runs scored, wickets taken, batting averages and such - and are based instead on more detailed data analyses of performances.
Which batsman played more consistently than any other over the entire year? Which batting pair was the most prolific through the year? Which bowler was at his best against the top batsmen of the year? The results are all based entirely on quantitative analyses of performance throughout the year, which makes these awards definitive and distinctive. Read on to find out more.
Note: all numbers exclude performances against Bangladesh, Zimbabwe, and other non-Test-playing teams.
Note: all numbers exclude performances against Bangladesh, Zimbabwe, and other non-Test-playing teams.
Main awards
Batsman of the year
Shivnarine Chanderpaul
Test index 117, ODI index 124.26. Total 241.26
The result was based on a batsman's performance against the list of top bowlers of the year, who were determined in the following manner: Tests: Top 15 averages among those who took at least 25 wickets in 2008.
ODIs: Top 15 bowling index (average multiplied by economy-rate) among bowlers who took at least 12 wickets in 2008. A batsman's average against these bowlers in Tests was his Test index, while the ODI index was calculated by multiplying the batsman's average by the number of runs scored per ball against these bowlers.
Shivnarine Chanderpaul was immense in both forms of the game in 2008: against the top teams in Tests, he scored 909 runs at an average of 101; in ODIs, he scored 578 runs at 64.22 and at a strike-rate of 74.96. He was even more immoveable against the best bowlers: in Tests he averaged 94.25 against them, and Muttiah Muralitharan, Brett Lee, Stuart Clark and Daniel Vettori were the only ones to dismiss him. In ODIs he averaged 155 against the top bowlers, at a scoring-rate of 4.81 per over, with only Nathan Bracken dismissing him. His overall index of 218.51 was well clear of the second-placed Graeme Smith's 126.13.
Bowler of the year
Ajantha Mendis
Test index 33.00, ODI index 8.88. Total 41.88
The result was based on bowlers' performance against the list of top batsmen of the year, who were determined in the following manner: Tests: Top 15 averages among batsmen who scored at least 750 runs in 2008.
ODIs: Top 15 ODI indexes (average multiplied by number of runs scored per ball) among batsmen who scored at least 400 runs in 2008.
The bowlers' average against these batsmen in Tests was their Test index, while the ODI index was calculated by multiplying the bowlers' average by the number of runs conceded per ball against these batsmen.
Dale Steyn had an outstanding year, but he was trumped by Sri Lanka's newest sensation, Ajantha Mendis, who took an amazing 26 Test wickets in three Tests, and as many in 10 ODIs against the top teams, but even more stunning was the manner in which he completely dominated top batsmen. Against the 15 best batsmen of the year he averaged 33, dismissing them nine times, while in ODIs he averaged 13.22 against them at an economy-rate of 4.02, giving him an ODI index of 8.88. Add the two, and his overall index was 41.88, by far the best.
Most consistent Test batsman
Shivnarine Chanderpaul
Consistency index 2.43
For the second year running, Chanderpaul bags this award. Like in 2007, he had six successive 50-plus scores in 2008 as well - the streak was 107*, 77*, 79*, 50, 76, 126*. Apart from that, he also had four other scores of more than 50, and all this in just 16 innings. His standard deviation - which measures the average distance from the mean - of 41.50 was only marginally poorer than his 2007 figure of 40.05. Combined with a fantastic average of 101, that gave him a consistency index (average divided by standard deviation) of 2.43.
Hashim Amla had a wonderfully consistent year, with a standard deviation of 37.21 and a consistency index of 1.42. Gautam Gambhir finished with one of 1.35, thanks to a year in which his lowest score in 16 innings was 19, and half his innings were between 35 and 75.
Best Test batsman
(cut-off: 750 runs against the top teams)
(cut-off: 750 runs against the top teams)
Shivnarine Chanderpaul
Graeme Smith scored the most runs in 2008, but Chanderpaul was truly prolific. In just nine Tests he scored 909 runs at an average of 101, with ten 50-plus scores in 16 innings. The next best, in terms of averages, was Gautam Gambhir, who scored at the rate of 70.87 for his 1134 runs.
Graeme Smith scored the most runs in 2008, but Chanderpaul was truly prolific. In just nine Tests he scored 909 runs at an average of 101, with ten 50-plus scores in 16 innings. The next best, in terms of averages, was Gautam Gambhir, who scored at the rate of 70.87 for his 1134 runs.
Best Test bowler
(cut-off: 30 wickets against the top teams)
(cut-off: 30 wickets against the top teams)
Ryan Sidebottom
The year ended disappointingly for Sidebottom, with several injury problems, but his haul for 2008 was impressive - 47 wickets in eight games against the top teams, at an average of 20.25. It was enough to pip Steyn, who took 52 wickets at 21.21, to second place.
The year ended disappointingly for Sidebottom, with several injury problems, but his haul for 2008 was impressive - 47 wickets in eight games against the top teams, at an average of 20.25. It was enough to pip Steyn, who took 52 wickets at 21.21, to second place.
Best ODI batsman
Younis Khan
Pakistan got little opportunity to play international cricket against meaningful opposition in 2008, but the few chances they got, Younis made them count: in eight ODIs against the top teams he scored 528 runs at 75.42 and at a strike-rate of 94.28. Multiply the average by the runs per ball, and his ODI batting index was 71.11. Virender Sehwag had a great ODI year too, averaging 47.25 at a rate of 113.17, for an index of 53.47.
Pakistan got little opportunity to play international cricket against meaningful opposition in 2008, but the few chances they got, Younis made them count: in eight ODIs against the top teams he scored 528 runs at 75.42 and at a strike-rate of 94.28. Multiply the average by the runs per ball, and his ODI batting index was 71.11. Virender Sehwag had a great ODI year too, averaging 47.25 at a rate of 113.17, for an index of 53.47.
Best ODI bowler
Ajantha Mendis
Mendis was the clear leader here - his 26 wickets came at an average of 10.46 and an economy-rate of 3.6, giving him an index of 6.28. Among those with at least 15 wickets against the top teams, Nathan Bracken was next - his average of 17.41 and economy-rate of 4.05 gave him an index of 11.75.
Mendis was the clear leader here - his 26 wickets came at an average of 10.46 and an economy-rate of 3.6, giving him an index of 6.28. Among those with at least 15 wickets against the top teams, Nathan Bracken was next - his average of 17.41 and economy-rate of 4.05 gave him an index of 11.75.
Other awards
Test batting
(Cut-off: 800 runs, unless mentioned otherwise)
Batting pair of the year: openers
(cut-off: at least ten innings)
(cut-off: at least ten innings)
Virender Sehwag and Gautam Gambhir
In another battle between India and South Africa, Sehwag and Gambhir won India the contest, scoring 972 runs for the opening wicket an average of 60.75, with three century stands in 16 innings. Smith and Neil McKenzie had an equal number of century stands in 18 innings, but they scored 968 runs at an average of 56.94. Matthew Hayden and Simon Katich were major disappointments: they averaged 30.92 in 15 innings, with only one century partnership.
In another battle between India and South Africa, Sehwag and Gambhir won India the contest, scoring 972 runs for the opening wicket an average of 60.75, with three century stands in 16 innings. Smith and Neil McKenzie had an equal number of century stands in 18 innings, but they scored 968 runs at an average of 56.94. Matthew Hayden and Simon Katich were major disappointments: they averaged 30.92 in 15 innings, with only one century partnership.
Batting pair of the year: others
(cut-off: at least ten innings)
(cut-off: at least ten innings)
Graeme Smith and Hashim Amla
South Africa win this one. In 11 innings, Amla and Smith added 748 runs at an average stand of 68, with two century partnerships - including 153 during the famous Perth run-chase - and three half-century stands. Katich and Ricky Ponting added 704, but needed 16 innings to do so, while VVS Laxman and Sachin Tendulkar put together 535 at 53.50.
South Africa win this one. In 11 innings, Amla and Smith added 748 runs at an average stand of 68, with two century partnerships - including 153 during the famous Perth run-chase - and three half-century stands. Katich and Ricky Ponting added 704, but needed 16 innings to do so, while VVS Laxman and Sachin Tendulkar put together 535 at 53.50.
Highest percentage of team runs
Shivnarine Chanderpaul
Chanderpaul pipped Smith to the top spot here, scoring 18.74% of West Indies' total runs (909 out of 4850). Apart from the fact that both were in glorious form, Chanderpaul was helped by the generally inept batting performances of the rest of the West Indians. Smith's percentage of 18.16 was assisted by the fact that he scored so many runs in successful run-chases, when the most of the rest of the entire line-up didn't get an opportunity to bat.
Chanderpaul pipped Smith to the top spot here, scoring 18.74% of West Indies' total runs (909 out of 4850). Apart from the fact that both were in glorious form, Chanderpaul was helped by the generally inept batting performances of the rest of the West Indians. Smith's percentage of 18.16 was assisted by the fact that he scored so many runs in successful run-chases, when the most of the rest of the entire line-up didn't get an opportunity to bat.
Most runs in wins
Graeme Smith
Smith takes the honours, with 795 runs in wins, at an average of 79.50. Sehwag came in next, with 728 runs in six wins at 66.18.
Smith takes the honours, with 795 runs in wins, at an average of 79.50. Sehwag came in next, with 728 runs in six wins at 66.18.
Highest percentage of runs in boundaries
Virender Sehwag
With 181 fours and 22 sixes, Sehwag took the honours quite comfortably here as well: of the 1462 runs he scored, 856 were in fours and sixes, giving him a percentage of 58.55. Smith followed, with 628 out of 1168 (53.77), while Rahul Dravid, Kevin Pietersen and Hashim Amla were the others who scored more than 50% of their runs through the boundary route. AT the bottom of this is Australia's Michael Clarke, who grafted his way to plenty of runs in 2008: only 420 of his 1063 runs came in fours and sixes, making him the only one in the list with a sub-40 percentage (39.51).
With 181 fours and 22 sixes, Sehwag took the honours quite comfortably here as well: of the 1462 runs he scored, 856 were in fours and sixes, giving him a percentage of 58.55. Smith followed, with 628 out of 1168 (53.77), while Rahul Dravid, Kevin Pietersen and Hashim Amla were the others who scored more than 50% of their runs through the boundary route. AT the bottom of this is Australia's Michael Clarke, who grafted his way to plenty of runs in 2008: only 420 of his 1063 runs came in fours and sixes, making him the only one in the list with a sub-40 percentage (39.51).
Highest strike rate
Virender Sehwag
Sehwag's audacity wins him this award by quite a distance. He scored 1462 runs in 1703 balls for a strike rate of 85.84, well clear of Smith, who scored at a rate of 63.92 (1168 runs in 1827 balls). At the bottom of this pile is Rahul Dravid, who despite getting the third-highest percentage of runs in boundaries had a strike rate of 38.60, which is an illustration of the number of dot-balls he played.
Sehwag's audacity wins him this award by quite a distance. He scored 1462 runs in 1703 balls for a strike rate of 85.84, well clear of Smith, who scored at a rate of 63.92 (1168 runs in 1827 balls). At the bottom of this pile is Rahul Dravid, who despite getting the third-highest percentage of runs in boundaries had a strike rate of 38.60, which is an illustration of the number of dot-balls he played.
Test bowling
Best strike rate
(cut off: 30 wickets)
(cut off: 30 wickets)
Dale Steyn
For the second year running, Steyn took this award for a strike-rate of 37.7 (52 wickets in 327.3 overs). Last year he achieved a rate of 29.66. He was well clear of the second-placed Sidebottom, who had a strike-rate of 45.3.
For the second year running, Steyn took this award for a strike-rate of 37.7 (52 wickets in 327.3 overs). Last year he achieved a rate of 29.66. He was well clear of the second-placed Sidebottom, who had a strike-rate of 45.3.
Best spinner
(cut off: 30 wickets)
(cut off: 30 wickets)
Shakib Al Hasan
Mendis, with 26 wickets, missed the cut-off, which gave Bangladesh's Shakib a chance to grab the prize. Shakib had an amazing year, taking 30 wickets in eight Tests at 25.76, slightly ahead of Muralitharan's 33 at 26.12.
Mendis, with 26 wickets, missed the cut-off, which gave Bangladesh's Shakib a chance to grab the prize. Shakib had an amazing year, taking 30 wickets in eight Tests at 25.76, slightly ahead of Muralitharan's 33 at 26.12.
Best third- and fourth-innings bowler
(cut off: 15 wickets)
(cut off: 15 wickets)
Harbhajan Singh
Harbhajan's 24 wickets in the third or fourth innings of Tests came at an average of 26.00. Murali and Monty Panesar were the only others to take more than 15 such wickets.
Harbhajan's 24 wickets in the third or fourth innings of Tests came at an average of 26.00. Murali and Monty Panesar were the only others to take more than 15 such wickets.
ODI batting
(Cut-off: at least 500 runs, unless mentioned otherwise)
Highest strike rate
Virender Sehwag
Sehwag and Yuvraj Singh were the only ones with a 100-plus strike-rate, but Sehwag was a convincing winner, with a figure of 113.17 (756 runs from 668 balls) - Yuvraj "only" managed a strike rate of 100.97.
Sehwag and Yuvraj Singh were the only ones with a 100-plus strike-rate, but Sehwag was a convincing winner, with a figure of 113.17 (756 runs from 668 balls) - Yuvraj "only" managed a strike rate of 100.97.
Lowest strike rate
Mahela Jayawardene
The Sri Lankan captain had a disappointing year in ODIs, averaging 34.06 against the top teams, and his 511 runs from 725 balls came him a scoring rate of 70.48. Kumar Sangakkara, his team-mate, was next with 73.49.
The Sri Lankan captain had a disappointing year in ODIs, averaging 34.06 against the top teams, and his 511 runs from 725 balls came him a scoring rate of 70.48. Kumar Sangakkara, his team-mate, was next with 73.49.
Batting pairs of the year
(cut-off: at least five innings)
(cut-off: at least five innings)
Opening: Brendon McCullum and Jesse Ryder
Sehwag and Gambhir had a great year, but they were topped by the New Zealand pair of Brendon McCullum and Jesse Ryder, who in five innings amassed 406 partnership runs at an average of 101.50 and a scoring-rate of 7.44 per over. That gives them a partnership index score (average stand multiplied by runs per ball) of 125.86. Their partnerships read 61, 165*, 7, 70 and 103. Sehwag and Gambhir scored 553 in nine innings at 61.44 and 6.82 runs per over (index score 69.84).
Sehwag and Gambhir had a great year, but they were topped by the New Zealand pair of Brendon McCullum and Jesse Ryder, who in five innings amassed 406 partnership runs at an average of 101.50 and a scoring-rate of 7.44 per over. That gives them a partnership index score (average stand multiplied by runs per ball) of 125.86. Their partnerships read 61, 165*, 7, 70 and 103. Sehwag and Gambhir scored 553 in nine innings at 61.44 and 6.82 runs per over (index score 69.84).
Others: MS Dhoni and Suresh Raina
Dhoni and Raina win this one, for scoring 407 runs in five innings at 81.40 per partnership and 5.61 runs per over (index score 76.11). Kevin Pietersen and Owais Shah were next, with an average of 59.20 at 6.85 (index score 67.59).
Dhoni and Raina win this one, for scoring 407 runs in five innings at 81.40 per partnership and 5.61 runs per over (index score 76.11). Kevin Pietersen and Owais Shah were next, with an average of 59.20 at 6.85 (index score 67.59).
Most runs in boundaries
Virender Sehwag
With 101 fours and 18 sixes, Sehwag dominated this list, and was well clear of the competition - 67.72% of runs in boundaries (512 out of 756). Yuvraj Singh followed, with a percentage of 58.24, while Chris Gayle was third at 58.05%.
With 101 fours and 18 sixes, Sehwag dominated this list, and was well clear of the competition - 67.72% of runs in boundaries (512 out of 756). Yuvraj Singh followed, with a percentage of 58.24, while Chris Gayle was third at 58.05%.
Lowest dot-ball percentage
Younis Khan
Younis was the only batsman to have a dot-ball percentage of less than 50: 42.65%. Pietersen was next at 50.45, while Shah was third with 51.16.
Younis was the only batsman to have a dot-ball percentage of less than 50: 42.65%. Pietersen was next at 50.45, while Shah was third with 51.16.
Highest dot-ball percentage
Tamim Iqbal
Bangladesh's opener had the honour of playing the highest percentage (64.93%) of dots, with Ian Bell only marginally behind at 64.24.
Bangladesh's opener had the honour of playing the highest percentage (64.93%) of dots, with Ian Bell only marginally behind at 64.24.
Highest percentage of team runs scored
Younis Khan
Younis, with 24.55% (528 out of 2151) beat Chris Gayle (21.68) and Chanderpaul (20.47), who were the only others to get more than 20% of the team runs scored in matches which they played.
Younis, with 24.55% (528 out of 2151) beat Chris Gayle (21.68) and Chanderpaul (20.47), who were the only others to get more than 20% of the team runs scored in matches which they played.
Highest percentage of team runs in wins
(cut-off: 300 runs in wins)
(cut-off: 300 runs in wins)
Younis Khan
Younis swept this one as well, scoring 422 out of Pakistan's 1424 runs in their five wins against the top teams in 2008, for a percentage of 29.63.
Younis swept this one as well, scoring 422 out of Pakistan's 1424 runs in their five wins against the top teams in 2008, for a percentage of 29.63.
ODI bowling
(Cut-off: at least 15 wickets, unless mentioned otherwise)
Best economy rate
Ajantha Mendis
With an economy rate of 3.60 runs per over, Mendis won this one too. Zaheer Khan was close on his heels, conceding just 3.84 per over. Daniel Vettori deserves a special mention too: he missed the cut-off by one wicket, but he conceded 3.68 runs per over in the 11 ODIs he played.
With an economy rate of 3.60 runs per over, Mendis won this one too. Zaheer Khan was close on his heels, conceding just 3.84 per over. Daniel Vettori deserves a special mention too: he missed the cut-off by one wicket, but he conceded 3.68 runs per over in the 11 ODIs he played.
Best dot-ball percentage
Mitchell Johnson
Mitchell Johnson had a dot-ball percentage of 68.37, marginally higher than his Australian team-mate Brett Lee (67.58). Zaheer was third with 66.99
Mitchell Johnson had a dot-ball percentage of 68.37, marginally higher than his Australian team-mate Brett Lee (67.58). Zaheer was third with 66.99
Lowest percentage of boundaries conceded
Ajantha Mendis
Of the 453 balls that be bowled Mendis conceded only 12 fours and seven sixes, which is a percentage of 4.19. The top three spots were all taken by spinners: Muralitharan was second (4.56) and Harbhajan Singh third (4.87).
Of the 453 balls that be bowled Mendis conceded only 12 fours and seven sixes, which is a percentage of 4.19. The top three spots were all taken by spinners: Muralitharan was second (4.56) and Harbhajan Singh third (4.87).
Worst economy rate
Irfan Pathan
Pathan bowled 146.3 overs, and went for 854 runs, an economy rate of 5.82. He was followed by two Pakistanis, Umar Gul (5.50) and Sohail Tanvir (5.49).
Pathan bowled 146.3 overs, and went for 854 runs, an economy rate of 5.82. He was followed by two Pakistanis, Umar Gul (5.50) and Sohail Tanvir (5.49).
Team
Most dominant: Tests
South Africa
South Africa averaged 45.28 runs per wicket when batting, and conceded 32.49 with the ball, a difference of 12.79. Sri Lanka were next, with a difference of 10.61. Australia had a difference of -0.35; last year their difference was a whopping 39.58 (batting average 64.11, bowling average 24.53).
South Africa averaged 45.28 runs per wicket when batting, and conceded 32.49 with the ball, a difference of 12.79. Sri Lanka were next, with a difference of 10.61. Australia had a difference of -0.35; last year their difference was a whopping 39.58 (batting average 64.11, bowling average 24.53).
Most dominant: ODIs
New Zealand
India may have won the most ODIs in 2008, but New Zealand had the best win-loss ratio, with six victories to only two defeats. They averaged 33.82 runs per wicket at 5.28 per over, while they conceded 26.63 per wicket at 4.8 to the over. The difference between the batting and bowling index (average multiplied by runs per ball) was 8.46, marginally ahead of Australia's 8.34.
India may have won the most ODIs in 2008, but New Zealand had the best win-loss ratio, with six victories to only two defeats. They averaged 33.82 runs per wicket at 5.28 per over, while they conceded 26.63 per wicket at 4.8 to the over. The difference between the batting and bowling index (average multiplied by runs per ball) was 8.46, marginally ahead of Australia's 8.34.
Most disciplined: ODIs
Bangladesh
Bangladesh may not have won much on the field, but they didn't give much away by way of extras. They got 350 when they batted, but conceded only 243 - with just 3 byes and 16 no-balls - for a differential of 107, the best among all teams.
Bangladesh may not have won much on the field, but they didn't give much away by way of extras. They got 350 when they batted, but conceded only 243 - with just 3 byes and 16 no-balls - for a differential of 107, the best among all teams.
Only statistics against the top teams (excluding Bangladesh, Zimbabwe, and all other non-Test-playing teams) have been included.