How do openers affect No. 3 batsmen?
The success or failure of openers shifts the average of No. 3 batsmen by about ten runs
Kartikeya Date
05-Oct-2013
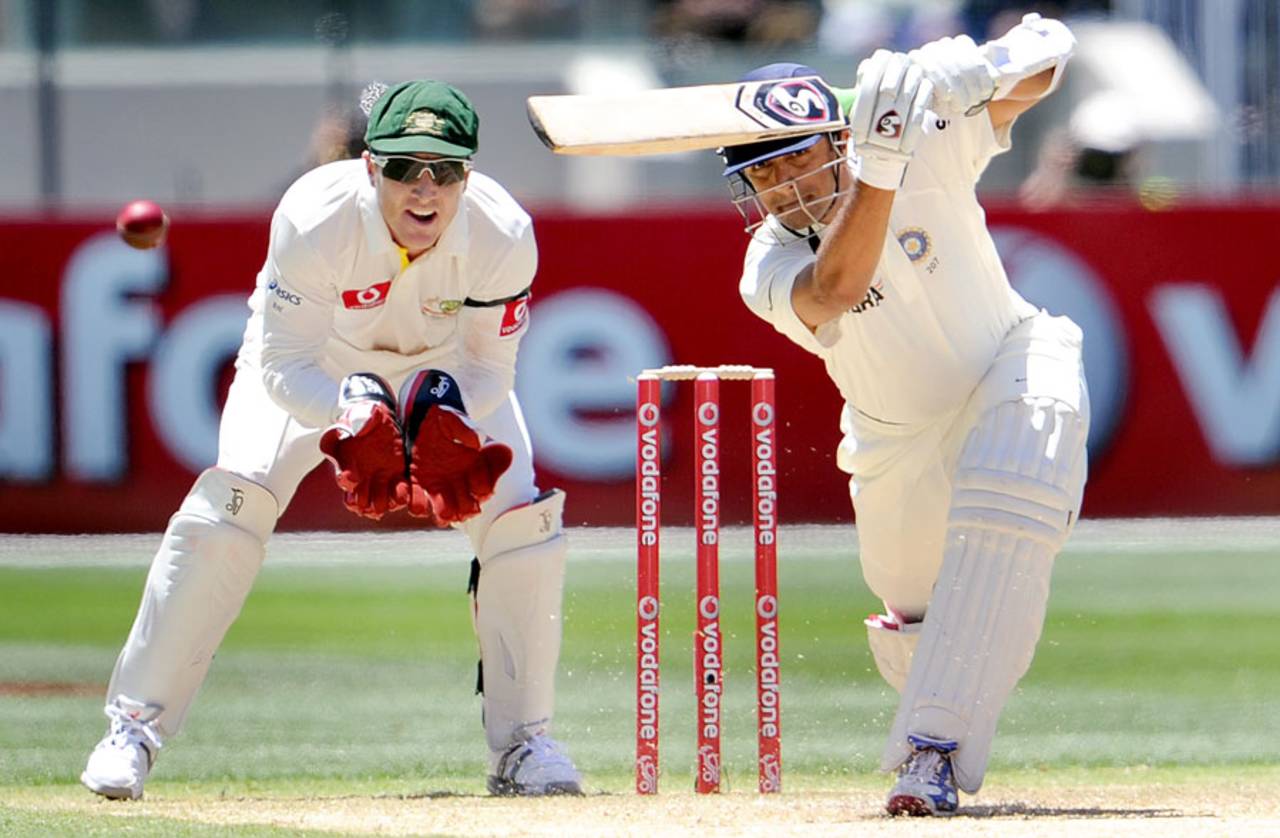
Rahul Dravid: had to follow failing openers in almost a fourth of his innings at No. 3 • AFP
No. 3: the best batsman in a Test team bats there. A list of most prolific No. 3 batsmen in Test history will confirm this. Donald Bradman, Wally Hammond, Viv Richards, Brian Lara, Ricky Ponting, Jacques Kallis, Kumar Sangakkara, Hashim Amla, Rohan Kanhai, Neil Harvey, Richie Richardson, Rahul Dravid. The list goes on. Both VVS Laxman and Dravid wanted to bat there. Dravid won that argument and VVS had to concede the point after a lean spell in the early 2000s.
Ian Chappell has argued that No. 3 batsmen set up Test matches. At No. 3, the contest between bat and ball has not yet been defined for the innings. No. 3 is a peculiar position - sandwiched between the middle order and the openers - where a batsman has to be prepared to walk in to face the second ball of the innings.
The history of Test cricket reveals that the success or failure of openers affect the average of the No. 3 batsman by about ten runs. The table below provides some figures. I looked at a number of conditions, and finally chose six to present here.
| All Test matches | Non-draws* | |||||
| No.3's Avg | Instance | No. 3's Avg | Instance | |||
| Openers score less than 10 | 33.60 | 768 | 30.60 | 567 | ||
| All Test innings | 39.90 | 7450 | 35.90 | 4850 | ||
| When at least one opener reaches 35 | 37.20 | 4108 | 40.10 | 2432 | ||
| When 1st wicket falls with score under 10 | 35.90 | 2171 | 33.00 | 2432 | ||
| Openers score less than 20 | 33.50 | 1819 | 30.30 | 1351 | ||
| At least one openers scores 50 or more | 45.30 | 2973 | 41.00 | 977 | ||
The No. 3 has averaged 40 runs per wicket in Test cricket. If we consider Tests which ended in a win, a loss, or a tie, and Test innings in which batsmen faced Bangladesh or Zimbabwe, the average runs made by a No. 3 Test batsman is 36. When both openers are dismissed for single figures, this drops down to 31. In fact, even if both openers are dismissed for less than 20, it drops down to 30 to 31. If at least one opener reaches 35 in non-draws, the No. 3 batsman averages 40. If at least one opener reaches 50, the No. 3 reaches 41.
In the population of No. 3 batting innings, there is some correlation between an opener's score and the No. 3 batsman's score. Part of this has to do with the conditions. Conditions that assist new-ball bowling generally make it less likely for the openers to survive.
Occasionally, the match situation also matters. If a team loses an opener early in its response to a large total, it allows the fielding captain to set attacking fields for much longer periods, as he has more runs to play with.
What of individual No. 3 batsmen? In what follows, I'll work with two definitions. Openers will be said to have failed when both are dismissed for a score under 20. They will be said to have succeeded when both score 20 or more. The former condition means two things: 1) The No. 3 batsman has to come in early in the innings. 2) The second wicket (i.e. the other opener) falls soon after the No. 3 batsman comes to the wicket. The latter condition means that the No. 3 can come into bat when the ball is no longer "new". It is worth pointing out that the median number of runs contributed by openers in innings where both cross 20 is 109.
| Player | Team | Aggregate | Dismissals | Innings | Average |
| R Dravid | India | 1861 | 48 | 51 | 38.80 |
| KC Sangakkara | Sri Lanka | 2068 | 43 | 46 | 48.10 |
| RR Sarwan | West Indies | 1213 | 28 | 28 | 43.30 |
| RB Richardson | West Indies | 1006 | 24 | 26 | 41.90 |
| Habibul Bashar | Bangladesh | 639 | 25 | 26 | 25.60 |
| DC Boon | Australia | 804 | 21 | 23 | 38.30 |
| SP Fleming | New Zealand | 607 | 22 | 23 | 27.60 |
| JH Kallis | South Africa | 779 | 19 | 22 | 41.00 |
| Younis Khan | Pakistan | 803 | 20 | 21 | 40.20 |
| BC Lara | West Indies | 961 | 20 | 20 | 48.10 |
| IM Chappell | Australia | 849 | 17 | 19 | 49.90 |
| RT Ponting | Australia | 665 | 18 | 19 | 36.90 |
| AH Jones | New Zealand | 574 | 19 | 19 | 30.20 |
| Saeed Ahmed | Pakistan | 506 | 19 | 19 | 26.60 |
| MW Goodwin | Zimbabwe | 489 | 18 | 19 | 27.20 |
| C Hill | Australia | 552 | 17 | 18 | 32.50 |
| Zaheer Abbas | Pakistan | 537 | 15 | 18 | 35.80 |
| AL Wadekar | India | 406 | 18 | 18 | 22.60 |
| RB Kanhai | West Indies | 912 | 16 | 17 | 57.00 |
| DI Gower | England | 509 | 17 | 17 | 29.90 |
| DB Vengsarkar | India | 283 | 15 | 16 | 18.90 |
| BE Congdon | New Zealand | 793 | 13 | 15 | 61.00 |
| HM Amla | South Africa | 767 | 13 | 15 | 59.00 |
| JL Langer | Australia | 756 | 15 | 15 | 50.40 |
| RN Harvey | Australia | 579 | 14 | 15 | 41.40 |
What stands out immediately is that some No. 3 batsmen have had to follow failing openers far more frequently than others. In the table above, I have only shown those No. 3 batsmen who have had to follow failing openers on 15 or more occasions. Dravid has had to follow failing openers in almost a fourth of his innings at No. 3. Sangakkara has a similar record. In contrast, Ponting has batted at No. 3 when both openers failed only 19 times in his 196 innings in that position. Kallis has had to do it 22 times in 78 innings. Two celebrated No. 3s are not in this list. Richards (59 innings at No. 3) and Greg Chappell (38 innings at No. 3) watched openers fail ten times each. Zaheer Abbas batted at No. 3 60 times. When the openers failed, his averaged dropped to 36.
What happens to No. 3 batsmen in innings where both openers cross 20?
| Player | Team | Aggregate | Dismissals | Innings | Average |
| RT Ponting | Australia | 3755 | 75 | 85 | 50.10 |
| R Dravid | India | 3887 | 64 | 69 | 60.70 |
| KC Sangakkara | Sri Lanka | 2623 | 35 | 40 | 74.90 |
| HM Amla | South Africa | 2251 | 34 | 38 | 66.20 |
| DC Boon | Australia | 1480 | 28 | 34 | 52.90 |
| RB Richardson | West Indies | 1571 | 28 | 31 | 56.10 |
| IM Chappell | Australia | 1390 | 26 | 28 | 53.50 |
| MA Butcher | England | 1009 | 26 | 27 | 38.80 |
| IVA Richards | West Indies | 1682 | 25 | 26 | 67.30 |
| RB Kanhai | West Indies | 1352 | 26 | 26 | 52.00 |
| JH Kallis | South Africa | 1199 | 20 | 24 | 60.00 |
| RN Harvey | Australia | 1492 | 22 | 24 | 67.80 |
| Younis Khan | Pakistan | 1279 | 22 | 24 | 58.10 |
| M Amarnath | India | 1198 | 19 | 22 | 63.10 |
| DB Vengsarkar | India | 892 | 19 | 21 | 46.90 |
| RR Sarwan | West Indies | 756 | 21 | 21 | 36.00 |
| BC Lara | West Indies | 1247 | 18 | 20 | 69.30 |
| IJL Trott | England | 848 | 16 | 20 | 53.00 |
| AH Jones | New Zealand | 537 | 16 | 19 | 33.60 |
| BE Congdon | New Zealand | 750 | 15 | 19 | 50.00 |
| N Hussain | England | 674 | 16 | 19 | 42.10 |
| DG Bradman | Australia | 1577 | 15 | 18 | 105.10 |
| ER Dexter | England | 1240 | 17 | 18 | 72.90 |
| WR Hammond | England | 1198 | 13 | 18 | 92.20 |
| Zaheer Abbas | Pakistan | 848 | 16 | 17 | 53.00 |
| C Hill | Australia | 770 | 15 | 16 | 51.30 |
| JA Rudolph | South Africa | 522 | 12 | 15 | 43.50 |
| MP Vaughan | England | 678 | 15 | 15 | 45.20 |
| WJ Edrich | England | 875 | 14 | 15 | 62.50 |
As you can see, the top No. 3 batsmen do far better when the openers succeed than when they do not. The phenomenal Bradman scored 5078 runs at No. 3 in only 56 innings. He averaged 105 when both openers succeeded. In seven innings when both openers failed, Bradman made 214 runs at 35. As you will see in the next table, when the first wicket fell for less than 20, and Bradman batted at No. 3, he averaged only 86!
The early wicket doesn't seem to matter very much. I looked at No. 3 batsmen's record in innings where the first wicket fell for a score of under 20. As you can see from the size of the table, this happens quite frequently. There are 65 batsmen who have walked in to bat after the first wicket fell for less than 20. The best batsmen have records under these conditions that are not significantly worse than their career records.
The interesting thing in this table from my point of view is that the batsmen who are normally considered to be technically excellent do worse than batsmen who are considered to be risk takers and stroke players. For example, Ponting, Sangakkara and Richards have done substantially better than Dravid, Kallis and Trott.
| Player | Team | Aggregate | Dismissals | Innings | Average |
| R Dravid | India | 4576 | 97 | 106 | 47.20 |
| KC Sangakkara | Sri Lanka | 4807 | 83 | 87 | 57.90 |
| RT Ponting | Australia | 3293 | 62 | 67 | 53.10 |
| DC Boon | Australia | 1868 | 42 | 47 | 44.50 |
| Habibul Bashar | Bangladesh | 1692 | 46 | 47 | 36.80 |
| RB Richardson | West Indies | 2066 | 43 | 46 | 48.00 |
| RR Sarwan | West Indies | 2024 | 42 | 43 | 48.20 |
| HM Amla | South Africa | 2012 | 37 | 41 | 56.80 |
| IM Chappell | Australia | 2014 | 38 | 41 | 55.40 |
| DB Vengsarkar | India | 1155 | 37 | 40 | 31.20 |
| SP Fleming | New Zealand | 1357 | 38 | 40 | 35.70 |
| JH Kallis | South Africa | 1503 | 34 | 39 | 44.20 |
| RB Kanhai | West Indies | 2178 | 38 | 39 | 57.30 |
| Younis Khan | Pakistan | 1691 | 34 | 35 | 49.70 |
| MA Butcher | England | 1172 | 31 | 34 | 37.80 |
| IJL Trott | England | 1117 | 32 | 33 | 34.90 |
| ALWadekar | India | 1007 | 32 | 32 | 31.50 |
| JL Langer | Australia | 1356 | 31 | 32 | 43.70 |
| BC Lara | West Indies | 1429 | 30 | 31 | 47.60 |
| RN Harvey | Australia | 1179 | 31 | 31 | 38.00 |
| SaeedAhmed | Pakistan | 1029 | 31 | 31 | 33.20 |
| DI Gower | England | 1077 | 30 | 30 | 35.90 |
| AHJones | New Zealand | 1394 | 28 | 29 | 49.80 |
| AP Gurusinha | Sri Lanka | 1049 | 25 | 29 | 42.00 |
| Azhar Ali | Pakistan | 1037 | 27 | 29 | 38.40 |
| C Hill | Australia | 914 | 27 | 28 | 33.90 |
| ADR Campbell | Zimbabwe | 925 | 27 | 27 | 34.30 |
| M Amarnath | India | 1192 | 27 | 27 | 44.10 |
| BE Congdonl | New Zealand | 1006 | 24 | 26 | 41.90 |
| N Hussain | England | 1229 | 22 | 26 | 55.90 |
| IVA Richards | West Indies | 1388 | 24 | 25 | 57.80 |
| Zaheer Abbas | Pakistan | 649 | 23 | 25 | 28.20 |
Generally, the figures suggest that the ability of opening batsmen to keep the new ball out is crucial. Given that Dravid and Ponting have played in the same era, it is difficult to argue that their records were built on significantly different wickets. Much of the difference between their records must be explained by the quality of openers they batted after. This matters when one compares their respective career records.
But I want to leave you with a thought about India's highly successful Test line-up in first 12 years of the 21st century. Rahul Dravid averaged 70 as an opener (made three centuries) in Tests. There is much truth, going by the figures, to suggest that the best, most attacking batsman in a team should bat at No. 3. What might have been had India's team management flipped the batting order to have Dravid open the batting, and Virender Sehwag bat at No. 3? Dravid's stated first ambition in each Test innings was to stay at the wicket for 30 overs. He was dismissed once every 123 balls in Tests. He was, by his own admission, a reluctant opening batsman. But if No. 3 batsmen flourish when the openers keep the bowling at bay at the start, and if stroke players thrive at No. 3, then did India make a colossal tactical error by having Sehwag open and Dravid bat at 3?
Kartikeya Date writes at A Cricketing View and tweets here