Home advantage in the IPL
Historically home games haven't been a huge advantage for teams, but this year 16 of the first 23 matches have been won by the home side
S Rajesh
19-Apr-2013
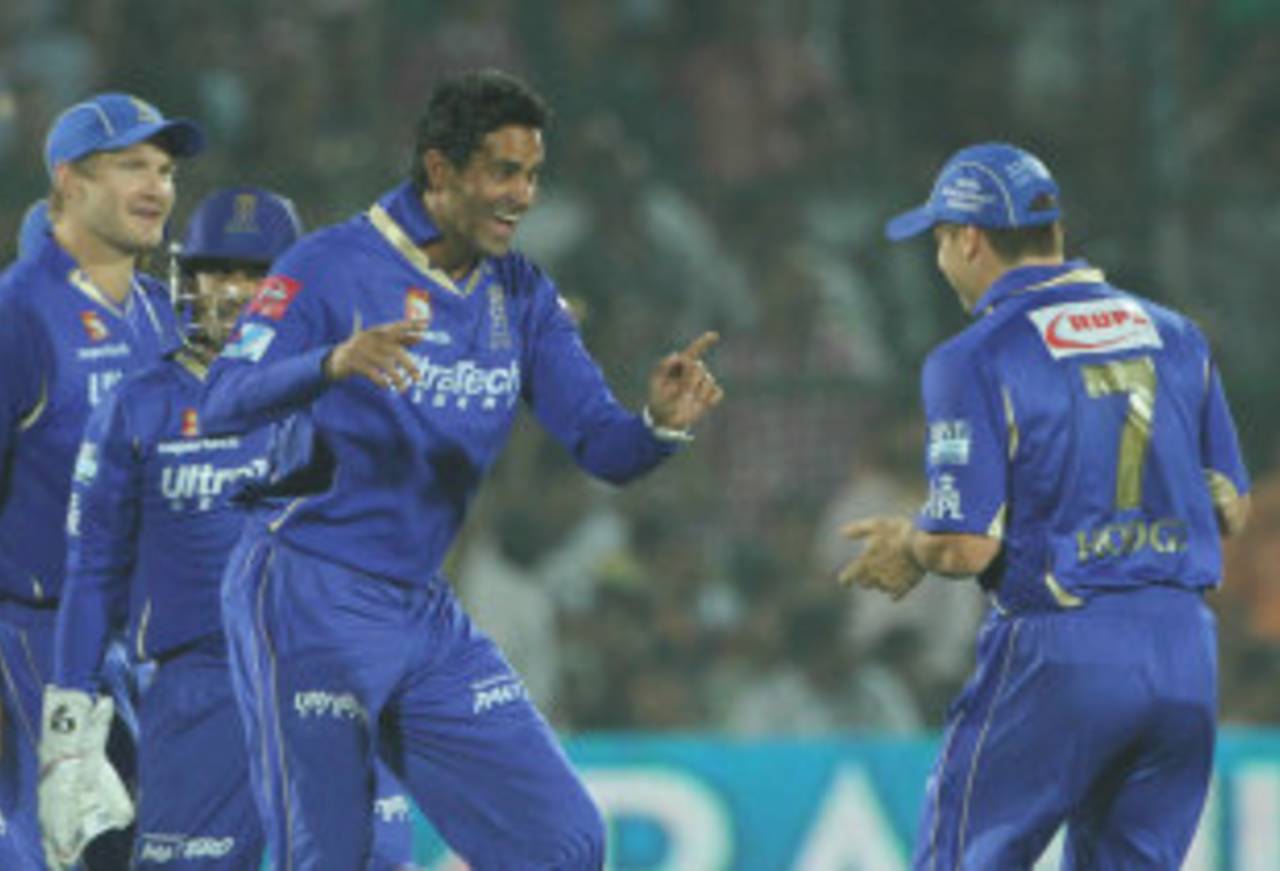
Rajasthan Royals are clearly the most dominant home team in the IPL, being the only side to have won twice as many matches as they have lost • BCCI
All stats updated till matches played on April 17
Should home advantage matter much in the IPL? You'd think not, given that the matches are all held in India (apart from the 2009 IPL in South Africa), where pitches are usually fairly similar to each other. Most of the players participating are Indians, many of whom have played first-class / age-group cricket at these grounds. The travel is a factor, but it's usually so for all teams, for the schedule doesn't normally allow for many home games in a row.
In the previous four editions when the tournament was held in India, the home teams didn't have a huge advantage in terms of favourable results, but with about a third of the games done this season, home teams have won an unusually high number of games. Out of 23 games so far in 2013, 16 have gone in favour of the home side, including two matches that went to the Super Over. Five teams haven't yet lost a home game, with Royal Challengers Bangalore winning four out of four, Rajasthan Royals three out of three, and three other teams - Kolkata Knight Riders, Mumbai Indians and Sunrisers Hyderabad - two of two. Overall, home teams have a win-loss ratio of 2.29 so far this season; in the four previous seasons when the tournament was held in India, the ratio for the home team was 1.06 (131 wins, 124 defeats).
In fact, last year playing at home was a disadvantage, with teams losing more home games than they won (32-40). That was an aberration, though, as home teams have generally had a slight advantage: in the first three seasons, they collectively won 15 more matches than they lost.
(These matches include all the league games which were played at the home venue for a team. For knockout games, the matches played at a franchise's home venue are taken as home games for that team. Knockout matches played at neutral venues are excluded from these calculations.)
| Season | Matches | Won-lost | Ratio |
| 2008 | 55 | 29-26 | 1.11 |
| 2010 | 58 | 32-26 | 1.23 |
| 2011 | 71 | 38-32 | 1.19 |
| 2012 | 73 | 32-40 | 0.80 |
| 2013 | 23 | 16-7 | 2.29 |
Since 2012 was an anomaly, and teams lost more home games than they won, let's examine the stats for each side last year. Of the nine teams that played last year, only two - Daredevils and Super Kings - won more home games than they lost. Royals won and lost four matches, while all the other sides had a negative record, with Pune Warriors' 2-6 being the worst of the lot.
None of the teams in 2012 made too much of their home advantage, which meant the deciding factor in the group stages was away performances. The team that won the tournament, Knight Riders, was unstoppable in away games, achieving a 7-1 win-loss record. Knight Riders also won the most important game of the tournament, the final, against Super Kings in Chennai, further improving their away record to 8-1. Mumbai Indians dominated their away games too, even as they struggled to win at home. Daredevils, the table-toppers, had a 6-2 away record in the league games, but spoilt it slightly by losing to Super Kings in the second qualifying game.
On the other hand, the teams that finished at the bottom of the points table, Deccan Chargers and Pune Warriors, both did terribly in away games. Chargers won only one out of eight - against Warriors in Pune - while Warriors managed to beat two heavyweight teams, Mumbai Indians and Daredevils, even as they lost to the others.
| Team | Matches | Won-lost | Ratio |
| Delhi Daredevils | 8 | 5-3 | 1.67 |
| Chennai Super Kings | 10 | 6-4 | 1.50 |
| Rajasthan Royals | 8 | 4-4 | 1.00 |
| Kolkata Knight Riders | 7 | 3-4 | 0.75 |
| Royal Challengers Bangalore | 8 | 3-4 | 0.75 |
| Deccan Chargers | 8 | 3-5 | 0.60 |
| Kings XI Punjab | 8 | 3-5 | 0.60 |
| Mumbai Indians | 8 | 3-5 | 0.60 |
| Pune Warriors | 8 | 2-6 | 0.33 |
| Team | Matches | Won-lost | Ratio |
| Kolkata Knight Riders | 9 | 8-1 | 8.00 |
| Mumbai Indians | 8 | 7-1 | 7.00 |
| Delhi Daredevils | 9 | 6-3 | 2.00 |
| Kings XI Punjab | 8 | 5-3 | 1.66 |
| Royal Challengers Bangalore | 8 | 5-3 | 1.66 |
| Chennai Super Kings | 8 | 3-4 | 0.75 |
| Rajasthan Royals | 8 | 3-5 | 0.60 |
| Pune Warriors | 8 | 2-6 | 0.33 |
| Deccan Chargers | 7 | 1-6 | 0.16 |
Royal Challengers have won all four of their home games in IPL 2013, but their overall win-loss record at the Chinnaswamy Stadium isn't all that impressive - 17 wins and 14 losses, for a win-loss ratio of 1.21. Before the start of the 2013 tournament, they had actually lost more than they had won at home - 13 wins, against 14 losses. In the first edition, in 2008, they struggled at home, winning one and losing six. Their best home season was in 2011, when they won five times and lost only once. Overall, their record when batting second at their home ground is much better than when batting first - they have a 10-6 record when chasing, compared to 6-8 when batting first.
The best home record over all five seasons, though, clearly belongs to Royals - they're the only team to have won more than twice as many games as they have lost. Most of that is because of their incredible record when batting second: out of 15 such matches they have won 12. Their best home season was in their title-winning campaign in 2008, when they had the perfect 7-0 record.
The two other teams who have been especially dominant at home are Super Kings and Knight Riders, though they've taken different routes to achieve their home wins. Super Kings have preferred batting first, putting up a big total, and then choking the opposition - they have a 14-6 record when batting first, and only 8-6 when chasing. Knight Riders, on the other hand, have preferred the chase, achieving a 10-4 record when batting second.
Compared to those records, Daredevils' stats at the Feroz Shah Kotla are pretty ordinary. They've lost three more games than they've won, and have been quite uninspiring both when batting first and chasing.
| Team | Ground | Matches | Won-lost (Total) | Ratio | Batting 1st | Chasing |
| Rajasthan Royals | Sawai Mansingh Stadium, Jaipur | 28 | 19-9 | 2.11 | 7-6 | 12-3 |
| Chennai Super Kings | MA Chidambaram Stadium, Chennai | 35 | 22-13* | 1.69 | 14-6 | 8-6 |
| Kolkata Knight Riders | Eden Gardens, Kolkata | 30 | 18-12 | 1.50 | 8-8 | 10-4 |
| Mumbai Indians | Wankhede Stadium, Mumbai | 22 | 12-10 | 1.20 | 6-6 | 6-4 |
| Kings XI Punjab | Punjab CA Stadium, Mohali | 24 | 13-11 | 1.18 | 6-7 | 7-4 |
| Royal Challengers Bangalore | M Chinnaswamy Stadium, Bangalore | 32 | 17*-14 | 1.21 | 6-8 | 10-6 |
| Delhi Daredevils | Feroz Shah Kotla, Delhi | 30 | 13-16 | 0.81 | 8-9 | 5-7 |
| Pune Warriors | Subrata Roy Sahara Stadium, Pune | 11 | 3-8 | 0.37 | 1-3 | 2-5 |
| Deccan Chargers | Rajiv Gandhi International Stadium, Uppal | 18 | 3-15 | 0.20 | 2-10 | 1-5 |
S Rajesh is stats editor of ESPNcricinfo. Follow him on Twitter